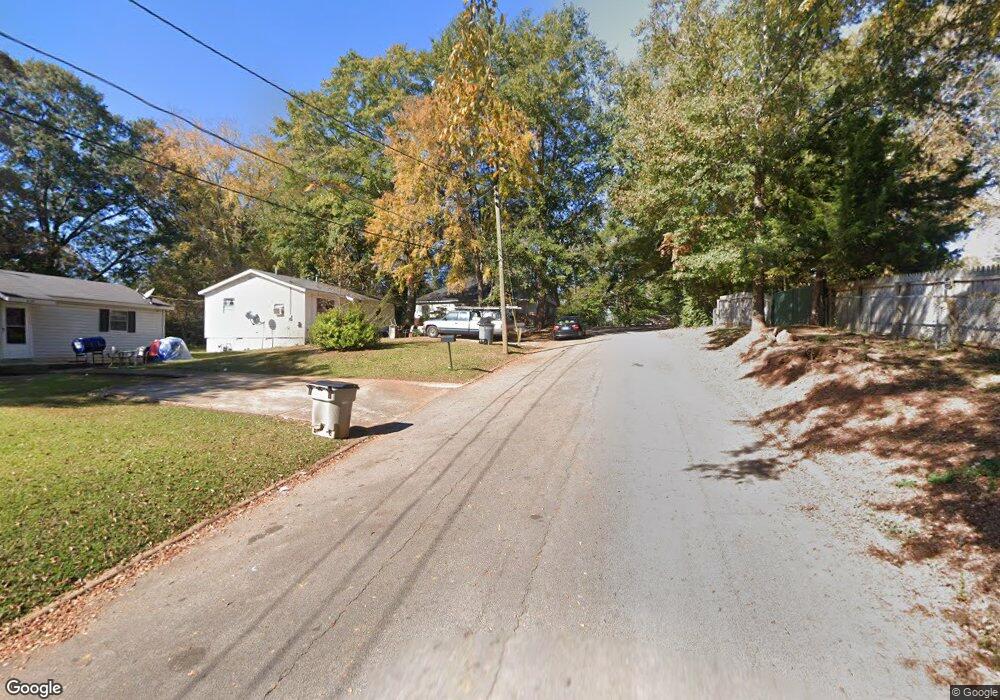
602 S Alford St Lagrange, GA 30240
Estimated Value: $152,000 - $192,000
4
Beds
2
Baths
1,700
Sq Ft
$102/Sq Ft
Est. Value
About This Home
This home is located at 602 S Alford St, Lagrange, GA 30240 and is currently estimated at $173,662, approximately $102 per square foot. 602 S Alford St is a home located in Troup County with nearby schools including Ethel W. Kight Elementary School, Hollis Hand Elementary School, and Franklin Forest Elementary School.
Ownership History
Date
Name
Owned For
Owner Type
Purchase Details
Closed on
Oct 23, 2019
Sold by
Patterson Jay Henry
Bought by
Patterson Sheila Marie and Patterson Christopher Martivis
Current Estimated Value
Purchase Details
Closed on
Feb 10, 2003
Sold by
Stargill Marlon and Stargill Lisa
Bought by
Patterson Jay H
Purchase Details
Closed on
Mar 28, 2002
Sold by
Lisa Marlon and Lisa Stargill
Bought by
Stargill Marlon and Stargill Lisa
Purchase Details
Closed on
Jan 31, 2001
Sold by
Morrow P
Bought by
Lisa Marlon and Lisa Stargill
Purchase Details
Closed on
Feb 13, 1998
Sold by
Bobby Morrow
Bought by
Morrow P
Purchase Details
Closed on
Nov 22, 1980
Sold by
F & S Enterprises Inc
Bought by
Bobby Morrow
Purchase Details
Closed on
Jan 1, 1972
Sold by
Gusto Brands Inc
Bought by
F & S Enterprises Inc
Purchase Details
Closed on
Jan 1, 1971
Sold by
Haralson Lonnie
Bought by
Gusto Brands Inc
Purchase Details
Closed on
Nov 1, 1962
Sold by
Moncus J T
Bought by
Haralson Lonnie
Create a Home Valuation Report for This Property
The Home Valuation Report is an in-depth analysis detailing your home's value as well as a comparison with similar homes in the area
Home Values in the Area
Average Home Value in this Area
Purchase History
| Date | Buyer | Sale Price | Title Company |
|---|---|---|---|
| Patterson Sheila Marie | -- | -- | |
| Patterson Jay H | $64,500 | -- | |
| Stargill Marlon | -- | -- | |
| Lisa Marlon | $2,000 | -- | |
| Morrow P | -- | -- | |
| Bobby Morrow | $19,500 | -- | |
| F & S Enterprises Inc | $10,400 | -- | |
| Gusto Brands Inc | -- | -- | |
| Haralson Lonnie | -- | -- |
Source: Public Records
Tax History Compared to Growth
Tax History
| Year | Tax Paid | Tax Assessment Tax Assessment Total Assessment is a certain percentage of the fair market value that is determined by local assessors to be the total taxable value of land and additions on the property. | Land | Improvement |
|---|---|---|---|---|
| 2024 | $1,073 | $39,360 | $5,880 | $33,480 |
| 2023 | $1,009 | $37,000 | $5,880 | $31,120 |
| 2022 | $982 | $35,200 | $5,880 | $29,320 |
| 2021 | $597 | $19,800 | $5,880 | $13,920 |
| 2020 | $597 | $19,800 | $5,880 | $13,920 |
| 2019 | $548 | $18,160 | $6,000 | $12,160 |
| 2018 | $548 | $18,160 | $6,000 | $12,160 |
| 2017 | $548 | $18,160 | $6,000 | $12,160 |
| 2016 | $578 | $19,165 | $6,000 | $13,165 |
| 2015 | $576 | $19,053 | $5,888 | $13,165 |
| 2014 | $254 | $18,360 | $5,888 | $12,472 |
| 2013 | -- | $22,224 | $5,940 | $16,284 |
Source: Public Records
Map
Nearby Homes
- 301 Wilkes St
- 303 Wilkes St
- 209 Wilkes St
- 605 Murphy Ave
- 604 S Alford St
- 305 Wilkes St
- 205 Wilkes St
- 609 Murphy Ave
- 606 Harwell Ave
- 611 Murphy Ave
- 203 Wilkes St
- 204 Wilkes St
- 0 Wilkes St Unit 8465039
- 0 Wilkes St Unit 8452329
- 0 Wilkes St
- 300 Wilkes St
- 613 Murphy Ave
- 613 S Alford St
- 304 Wilkes St
- 612 Murphy Ave