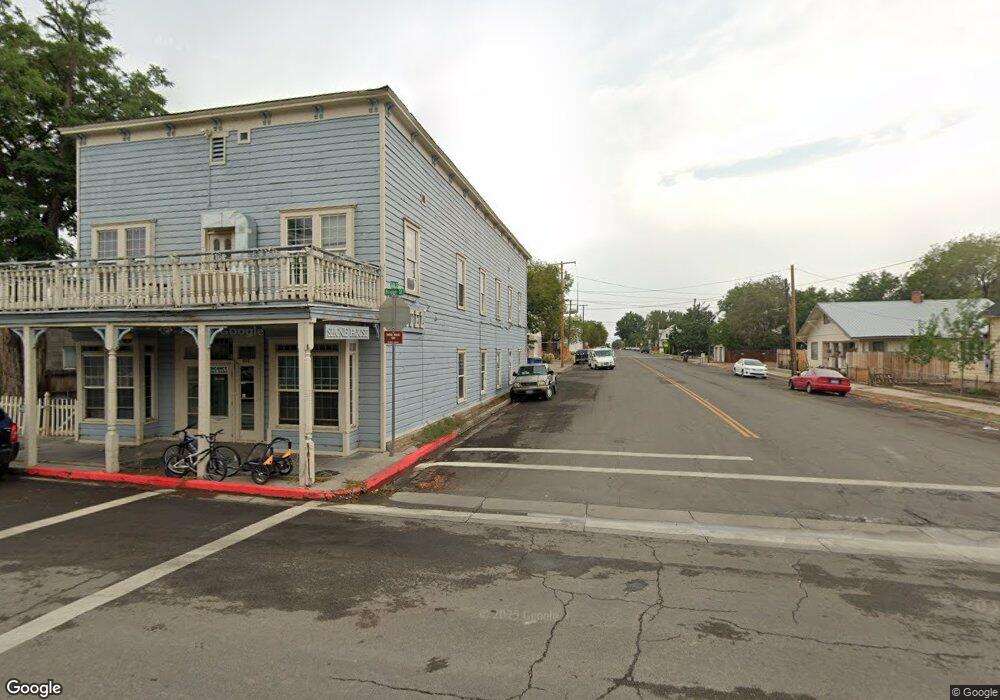
602 S Bridge St Winnemucca, NV 89445
Estimated Value: $782,649
20
Beds
1
Bath
5,170
Sq Ft
$151/Sq Ft
Est. Value
About This Home
This home is located at 602 S Bridge St, Winnemucca, NV 89445 and is currently estimated at $782,649, approximately $151 per square foot. 602 S Bridge St is a home located in Humboldt County with nearby schools including Sonoma Heights Elementary School, Winnemucca Junior High School, and French Ford Middle School.
Ownership History
Date
Name
Owned For
Owner Type
Purchase Details
Closed on
Jun 13, 2013
Sold by
Delgado Luz Maria Ramirez
Bought by
Bricker Kenny
Current Estimated Value
Home Financials for this Owner
Home Financials are based on the most recent Mortgage that was taken out on this home.
Original Mortgage
$85,000
Outstanding Balance
$60,475
Interest Rate
3.57%
Mortgage Type
Commercial
Estimated Equity
$722,174
Purchase Details
Closed on
Jun 6, 2011
Sold by
County Of Humboldt
Bought by
Norris William
Purchase Details
Closed on
Feb 10, 2005
Sold by
Jones Harold L and Jones
Bought by
Norris William
Create a Home Valuation Report for This Property
The Home Valuation Report is an in-depth analysis detailing your home's value as well as a comparison with similar homes in the area
Home Values in the Area
Average Home Value in this Area
Purchase History
| Date | Buyer | Sale Price | Title Company |
|---|---|---|---|
| Bricker Kenny | -- | Western Title Company | |
| Bricker Kenny | $295,000 | Western Title Company | |
| Norris William | $2,844 | None Available | |
| Norris William | $135,000 | Western Title Company Inc |
Source: Public Records
Mortgage History
| Date | Status | Borrower | Loan Amount |
|---|---|---|---|
| Open | Bricker Kenny | $85,000 |
Source: Public Records
Tax History Compared to Growth
Tax History
| Year | Tax Paid | Tax Assessment Tax Assessment Total Assessment is a certain percentage of the fair market value that is determined by local assessors to be the total taxable value of land and additions on the property. | Land | Improvement |
|---|---|---|---|---|
| 2025 | $3,243 | $66,276 | $7,350 | $58,926 |
| 2024 | $3,135 | $67,265 | $7,350 | $59,914 |
| 2023 | $3,135 | $61,296 | $7,350 | $53,946 |
| 2022 | $2,946 | $52,814 | $7,350 | $45,464 |
| 2021 | $2,870 | $50,393 | $7,350 | $43,043 |
| 2020 | $2,838 | $50,861 | $7,350 | $43,511 |
| 2019 | $2,784 | $48,944 | $7,350 | $41,594 |
| 2018 | $2,692 | $44,782 | $7,350 | $37,432 |
| 2017 | $2,689 | $44,699 | $7,350 | $37,349 |
| 2016 | $2,681 | $43,615 | $7,350 | $36,265 |
| 2015 | $2,487 | $42,666 | $7,350 | $35,316 |
| 2014 | $2,487 | $41,134 | $7,350 | $33,784 |
Source: Public Records
Map
Nearby Homes