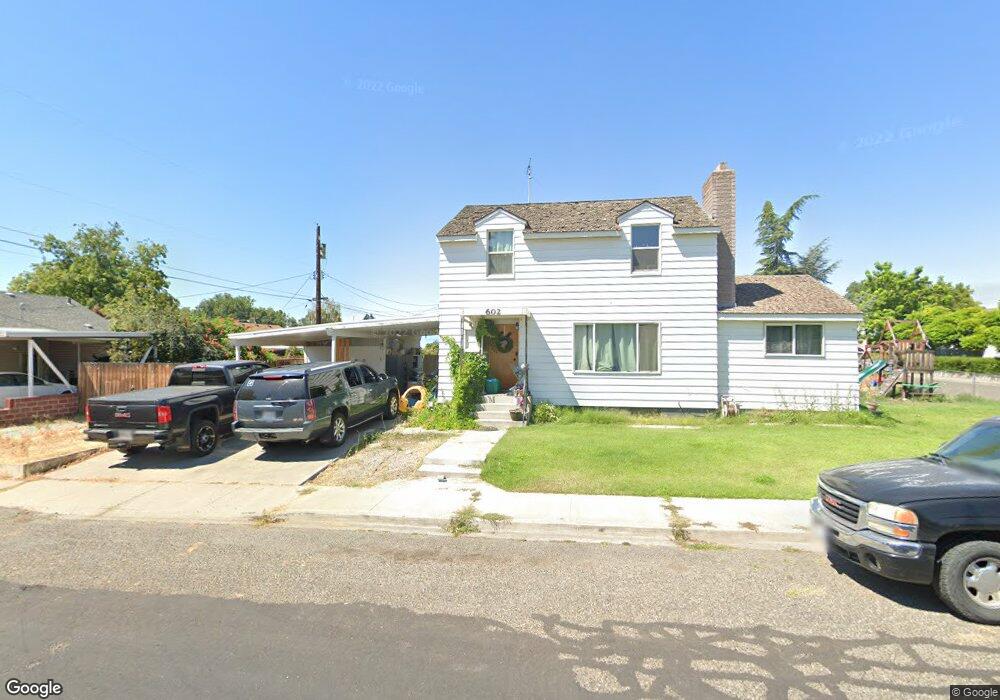
602 Taylor St Richland, WA 99354
Estimated Value: $364,000 - $434,000
4
Beds
2
Baths
1,500
Sq Ft
$258/Sq Ft
Est. Value
About This Home
This home is located at 602 Taylor St, Richland, WA 99354 and is currently estimated at $387,166, approximately $258 per square foot. 602 Taylor St is a home located in Benton County with nearby schools including Jefferson Elementary School, Chief Joseph Middle School, and Richland High School.
Ownership History
Date
Name
Owned For
Owner Type
Purchase Details
Closed on
Apr 23, 2014
Sold by
Langford Bobby D
Bought by
Langford Jessica
Current Estimated Value
Purchase Details
Closed on
May 28, 2008
Sold by
Welch Sarah and Welch Robert
Bought by
Langford Bobby D and Langford Jessica
Home Financials for this Owner
Home Financials are based on the most recent Mortgage that was taken out on this home.
Original Mortgage
$147,682
Outstanding Balance
$93,891
Interest Rate
5.87%
Mortgage Type
FHA
Estimated Equity
$293,275
Purchase Details
Closed on
Apr 5, 2005
Sold by
Lariviere Thomas L
Bought by
Day Sarah
Home Financials for this Owner
Home Financials are based on the most recent Mortgage that was taken out on this home.
Original Mortgage
$114,086
Interest Rate
5.7%
Mortgage Type
FHA
Create a Home Valuation Report for This Property
The Home Valuation Report is an in-depth analysis detailing your home's value as well as a comparison with similar homes in the area
Home Values in the Area
Average Home Value in this Area
Purchase History
| Date | Buyer | Sale Price | Title Company |
|---|---|---|---|
| Langford Jessica | -- | None Available | |
| Langford Bobby D | $150,000 | Cascade Title | |
| Day Sarah | $115,000 | Chicago Title |
Source: Public Records
Mortgage History
| Date | Status | Borrower | Loan Amount |
|---|---|---|---|
| Open | Langford Bobby D | $147,682 | |
| Previous Owner | Day Sarah | $114,086 |
Source: Public Records
Tax History Compared to Growth
Tax History
| Year | Tax Paid | Tax Assessment Tax Assessment Total Assessment is a certain percentage of the fair market value that is determined by local assessors to be the total taxable value of land and additions on the property. | Land | Improvement |
|---|---|---|---|---|
| 2024 | $2,761 | $316,480 | $50,000 | $266,480 |
| 2023 | $2,761 | $293,310 | $50,000 | $243,310 |
| 2022 | $2,548 | $252,760 | $50,000 | $202,760 |
| 2021 | $2,319 | $229,580 | $50,000 | $179,580 |
| 2020 | $2,462 | $200,620 | $50,000 | $150,620 |
| 2019 | $2,079 | $201,520 | $24,000 | $177,520 |
| 2018 | $1,988 | $183,160 | $24,000 | $159,160 |
| 2017 | $1,748 | $146,430 | $24,000 | $122,430 |
| 2016 | $1,722 | $146,430 | $24,000 | $122,430 |
| 2015 | $1,637 | $146,430 | $24,000 | $122,430 |
| 2014 | -- | $136,510 | $24,000 | $112,510 |
| 2013 | -- | $136,510 | $24,000 | $112,510 |
Source: Public Records
Map
Nearby Homes
- 509 Taylor St
- 609 Torbett St
- 1511 Goethals Dr
- 1509 Kimball Ave
- 1311 Goethals Dr Unit E
- 1609 Judson Ave
- 1405 Marshall Ave
- 1603 Mahan Ave
- 1116 Thayer Dr
- 1314 Potter Ave
- 1510 Wilson St
- 1323 Potter Ave
- 1509 Potter Ave
- 1214 Potter Ave
- 1118 Potter Ave
- 947 Long Ave
- 1904 Thompson St
- 1308 Swift Blvd
- 1914 Mahan Ave
- 78 Whitten St
- 1415 Judson Ave
- 601 Taylor St
- 1412 Judson Ave
- 1416 Goethals Dr
- 1414/1416 Judson Ave
- 607 Taylor St
- 1416 Judson Ave
- 607 Taylor St
- 1410 Judson Ave
- 1419 Judson Ave
- 1407 Judson Ave
- 1421 Judson Ave
- 1420 Goethals Dr
- 506 Taylor St
- 1422 Goethals Dr
- 1420 Judson Ave
- 1415 Goethals Dr
- 1423 Judson Ave
- 1411 Johnston Ave
- 604 Symons St