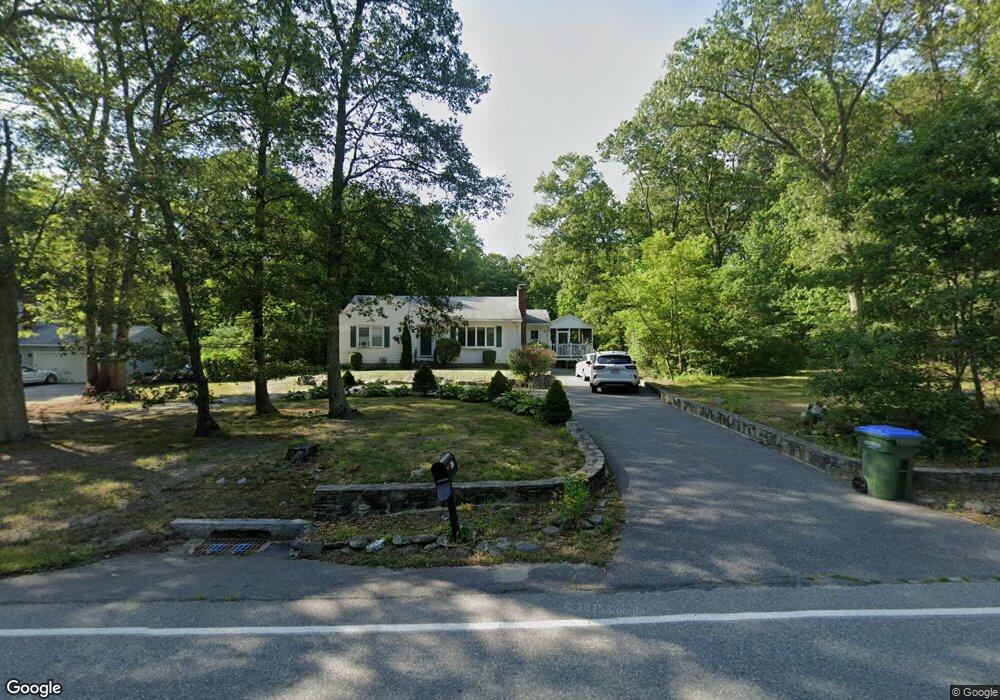
602 Tremont St Rehoboth, MA 02769
Estimated Value: $453,417 - $503,000
2
Beds
1
Bath
1,140
Sq Ft
$428/Sq Ft
Est. Value
About This Home
This home is located at 602 Tremont St, Rehoboth, MA 02769 and is currently estimated at $487,354, approximately $427 per square foot. 602 Tremont St is a home located in Bristol County with nearby schools including Dighton-Rehoboth Regional High School, Grace Baptist Christian Academy, and St Cecilia School.
Ownership History
Date
Name
Owned For
Owner Type
Purchase Details
Closed on
Jul 12, 2025
Sold by
Spurr Kathryn M
Bought by
Strobel Kristen M and Walsh Karen M
Current Estimated Value
Purchase Details
Closed on
Jun 18, 2010
Sold by
Spurr Kathryn M
Bought by
Spurr Kathryn M and Spurr William N
Purchase Details
Closed on
Nov 2, 2004
Sold by
Brousseau Carmela M
Bought by
Brousseau Carmela M
Purchase Details
Closed on
May 1, 1967
Bought by
Spurr Kathryn M
Create a Home Valuation Report for This Property
The Home Valuation Report is an in-depth analysis detailing your home's value as well as a comparison with similar homes in the area
Home Values in the Area
Average Home Value in this Area
Purchase History
| Date | Buyer | Sale Price | Title Company |
|---|---|---|---|
| Strobel Kristen M | -- | -- | |
| Strobel Kristen M | -- | -- | |
| Spurr Kathryn M | -- | -- | |
| Spurr Kathryn M | -- | -- | |
| Brousseau Carmela M | -- | -- | |
| Brousseau Carmela M | -- | -- | |
| Spurr Kathryn M | -- | -- |
Source: Public Records
Tax History Compared to Growth
Tax History
| Year | Tax Paid | Tax Assessment Tax Assessment Total Assessment is a certain percentage of the fair market value that is determined by local assessors to be the total taxable value of land and additions on the property. | Land | Improvement |
|---|---|---|---|---|
| 2025 | $3,876 | $347,600 | $189,400 | $158,200 |
| 2024 | $3,635 | $320,000 | $172,100 | $147,900 |
| 2023 | $3,607 | $311,500 | $168,900 | $142,600 |
| 2022 | $3,648 | $287,900 | $168,900 | $119,000 |
| 2021 | $3,456 | $261,000 | $153,800 | $107,200 |
| 2020 | $3,104 | $236,600 | $137,700 | $98,900 |
| 2018 | $2,917 | $243,700 | $147,200 | $96,500 |
| 2017 | $2,890 | $230,100 | $154,800 | $75,300 |
| 2016 | $2,731 | $224,800 | $147,200 | $77,600 |
| 2015 | $2,709 | $220,100 | $148,400 | $71,700 |
| 2014 | $2,657 | $213,600 | $141,900 | $71,700 |
Source: Public Records
Map
Nearby Homes