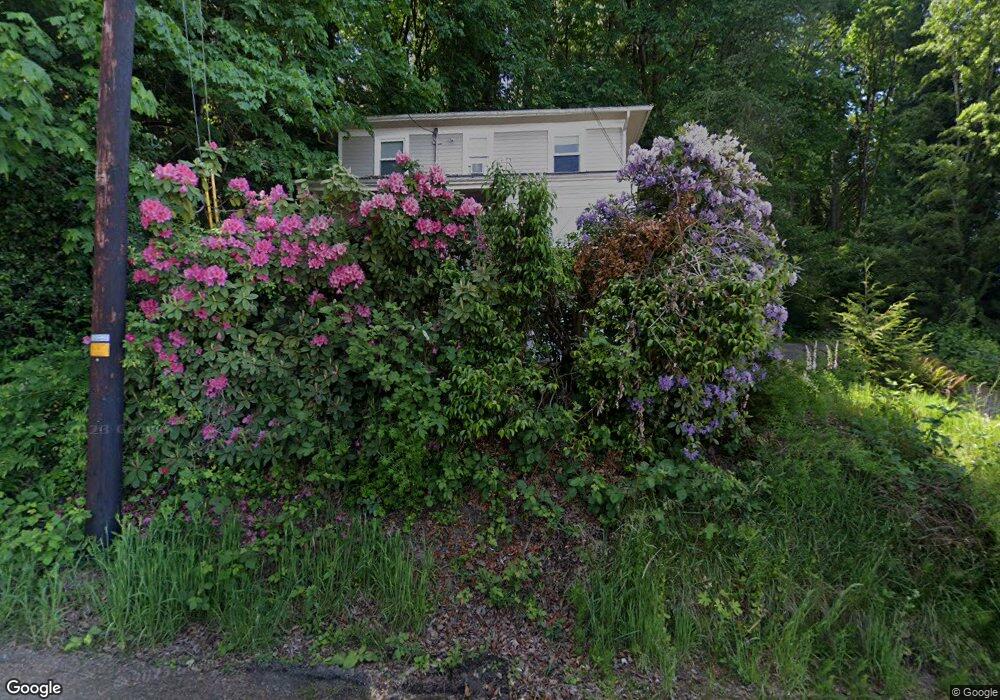
602 W 4th St Rainier, OR 97048
Estimated Value: $317,822 - $417,000
4
Beds
2
Baths
1,848
Sq Ft
$198/Sq Ft
Est. Value
About This Home
This home is located at 602 W 4th St, Rainier, OR 97048 and is currently estimated at $365,206, approximately $197 per square foot. 602 W 4th St is a home located in Columbia County with nearby schools including Hudson Park Elementary School, Rainier Junior/Senior High School, and North Columbia Academy.
Ownership History
Date
Name
Owned For
Owner Type
Purchase Details
Closed on
May 25, 2010
Sold by
Bledsoe Kelly and Bledsoe Sarah
Bought by
K & S Bledsoe Llc
Current Estimated Value
Purchase Details
Closed on
Jan 6, 2009
Sold by
Johnson Gabrielle N
Bought by
Deutsche Bank National Trust Company
Purchase Details
Closed on
Apr 6, 2005
Sold by
Johnson Ray W and Johnson Elvena A
Bought by
Johnson Gabrielle N
Create a Home Valuation Report for This Property
The Home Valuation Report is an in-depth analysis detailing your home's value as well as a comparison with similar homes in the area
Home Values in the Area
Average Home Value in this Area
Purchase History
| Date | Buyer | Sale Price | Title Company |
|---|---|---|---|
| K & S Bledsoe Llc | -- | None Available | |
| Deutsche Bank National Trust Company | $111,662 | None Available | |
| Johnson Gabrielle N | $127,000 | Ticor Title |
Source: Public Records
Tax History Compared to Growth
Tax History
| Year | Tax Paid | Tax Assessment Tax Assessment Total Assessment is a certain percentage of the fair market value that is determined by local assessors to be the total taxable value of land and additions on the property. | Land | Improvement |
|---|---|---|---|---|
| 2025 | $2,363 | $127,940 | $52,080 | $75,860 |
| 2024 | $2,308 | $124,220 | $50,570 | $73,650 |
| 2023 | $2,117 | $112,200 | $35,810 | $76,390 |
| 2022 | $2,022 | $108,940 | $34,780 | $74,160 |
| 2021 | $1,989 | $105,770 | $33,350 | $72,420 |
| 2020 | $1,933 | $102,690 | $29,870 | $72,820 |
| 2019 | $1,902 | $99,700 | $31,540 | $68,160 |
| 2018 | $1,858 | $96,800 | $47,240 | $49,560 |
| 2017 | $1,841 | $93,990 | $45,860 | $48,130 |
| 2016 | $1,789 | $91,260 | $44,520 | $46,740 |
| 2015 | $1,447 | $82,520 | $38,870 | $43,650 |
| 2014 | $1,373 | $78,360 | $38,800 | $39,560 |
Source: Public Records
Map
Nearby Homes