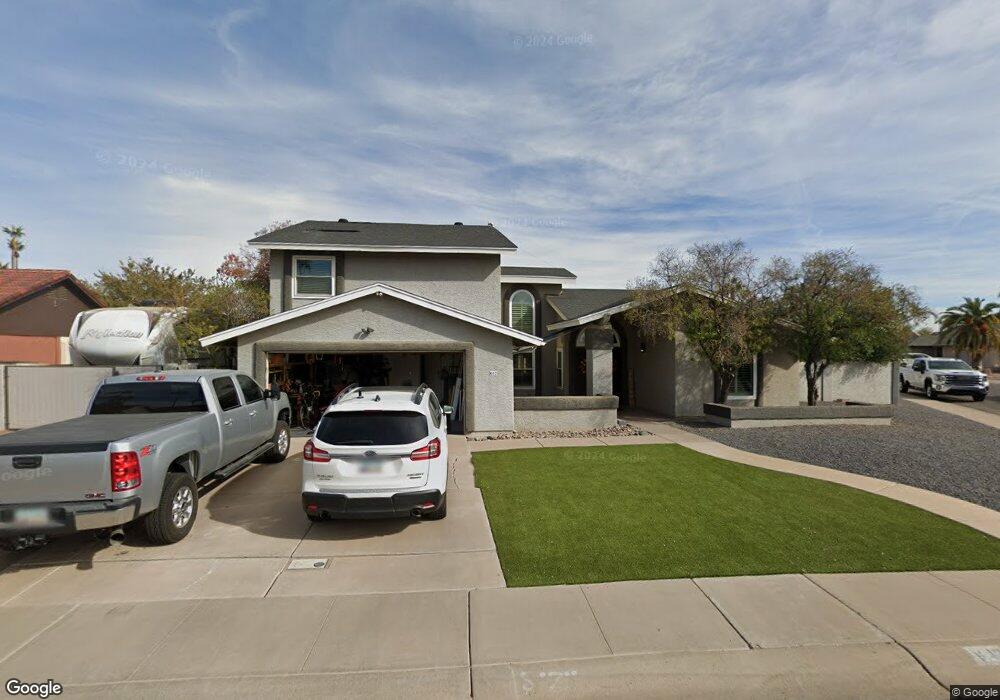
602 W Straford Dr Chandler, AZ 85225
Amberwood NeighborhoodEstimated Value: $527,097 - $654,000
4
Beds
3
Baths
2,452
Sq Ft
$247/Sq Ft
Est. Value
About This Home
This home is located at 602 W Straford Dr, Chandler, AZ 85225 and is currently estimated at $605,524, approximately $246 per square foot. 602 W Straford Dr is a home located in Maricopa County with nearby schools including Sirrine Elementary School, Franklin at Brimhall Elementary School, and Summit Academy Elementary.
Ownership History
Date
Name
Owned For
Owner Type
Purchase Details
Closed on
Aug 25, 2012
Sold by
Hendren Scott and Hendren Patricia
Bought by
Hendren Scott and Hendren Patricia
Current Estimated Value
Home Financials for this Owner
Home Financials are based on the most recent Mortgage that was taken out on this home.
Original Mortgage
$275,831
Outstanding Balance
$190,232
Interest Rate
3.5%
Mortgage Type
FHA
Estimated Equity
$415,292
Purchase Details
Closed on
Apr 24, 2008
Sold by
Dudley John C and Dudley Dana R
Bought by
Hendren Scott and Abbate Patricia
Home Financials for this Owner
Home Financials are based on the most recent Mortgage that was taken out on this home.
Original Mortgage
$290,442
Interest Rate
6.04%
Mortgage Type
FHA
Purchase Details
Closed on
Apr 29, 1996
Sold by
Mallik Debendra and Mallik Arundhati
Bought by
Hughes Frederick D and Hughes Mabel
Home Financials for this Owner
Home Financials are based on the most recent Mortgage that was taken out on this home.
Original Mortgage
$104,925
Interest Rate
7.97%
Mortgage Type
New Conventional
Create a Home Valuation Report for This Property
The Home Valuation Report is an in-depth analysis detailing your home's value as well as a comparison with similar homes in the area
Home Values in the Area
Average Home Value in this Area
Purchase History
| Date | Buyer | Sale Price | Title Company |
|---|---|---|---|
| Hendren Scott | -- | Dhi Title Agency | |
| Hendren Scott | $295,000 | Chicago Title Insurance Comp | |
| Hughes Frederick D | $139,900 | United Title Agency |
Source: Public Records
Mortgage History
| Date | Status | Borrower | Loan Amount |
|---|---|---|---|
| Open | Hendren Scott | $275,831 | |
| Previous Owner | Hendren Scott | $290,442 | |
| Previous Owner | Hughes Frederick D | $104,925 |
Source: Public Records
Tax History Compared to Growth
Tax History
| Year | Tax Paid | Tax Assessment Tax Assessment Total Assessment is a certain percentage of the fair market value that is determined by local assessors to be the total taxable value of land and additions on the property. | Land | Improvement |
|---|---|---|---|---|
| 2025 | $2,188 | $25,700 | -- | -- |
| 2024 | $2,212 | $24,476 | -- | -- |
| 2023 | $2,212 | $44,250 | $8,850 | $35,400 |
| 2022 | $2,152 | $33,100 | $6,620 | $26,480 |
| 2021 | $2,164 | $31,280 | $6,250 | $25,030 |
| 2020 | $2,140 | $28,510 | $5,700 | $22,810 |
| 2019 | $1,970 | $26,730 | $5,340 | $21,390 |
| 2018 | $1,914 | $24,810 | $4,960 | $19,850 |
| 2017 | $1,840 | $23,510 | $4,700 | $18,810 |
| 2016 | $1,800 | $23,760 | $4,750 | $19,010 |
| 2015 | $1,694 | $20,260 | $4,050 | $16,210 |
Source: Public Records
Map
Nearby Homes
- 3412 N Hartford St
- 400 W Crofton St
- 3401 N Dakota St
- 719 W Pampa Ave
- 707 W Bentrup St
- 3139 S Date Cir
- 535 W Pantera Ave
- 537 W Posada Ave
- 2900 N Nebraska St
- 2986 N Oregon St Unit 7
- 2970 N Oregon St Unit 10
- 3491 N Arizona Ave Unit 83
- 3491 N Arizona Ave Unit 152
- 3491 N Arizona Ave Unit 103
- 3491 N Arizona Ave Unit 138
- 2954 N Oregon St Unit 6
- 2855 S Extension Rd Unit 112
- 2855 S Extension Rd Unit 118
- 2603 N Hartford St
- 623 W Guadalupe Rd Unit 254
- 604 W Straford Dr
- 603 W Summit Place
- 601 W Summit Place
- 605 W Summit Place
- 605 W Straford Dr
- 611 W Straford Dr
- 606 W Straford Dr
- 607 W Straford Dr
- 603 W Straford Dr
- 609 W Straford Dr
- 613 W Straford Dr
- 607 W Summit Place
- 601 W Straford Dr
- 608 W Straford Dr
- 615 W Straford Dr
- 609 W Summit Place
- 606 W Chilton St
- 604 W Summit Place
- 604 W Chilton St
- 602 W Summit Place