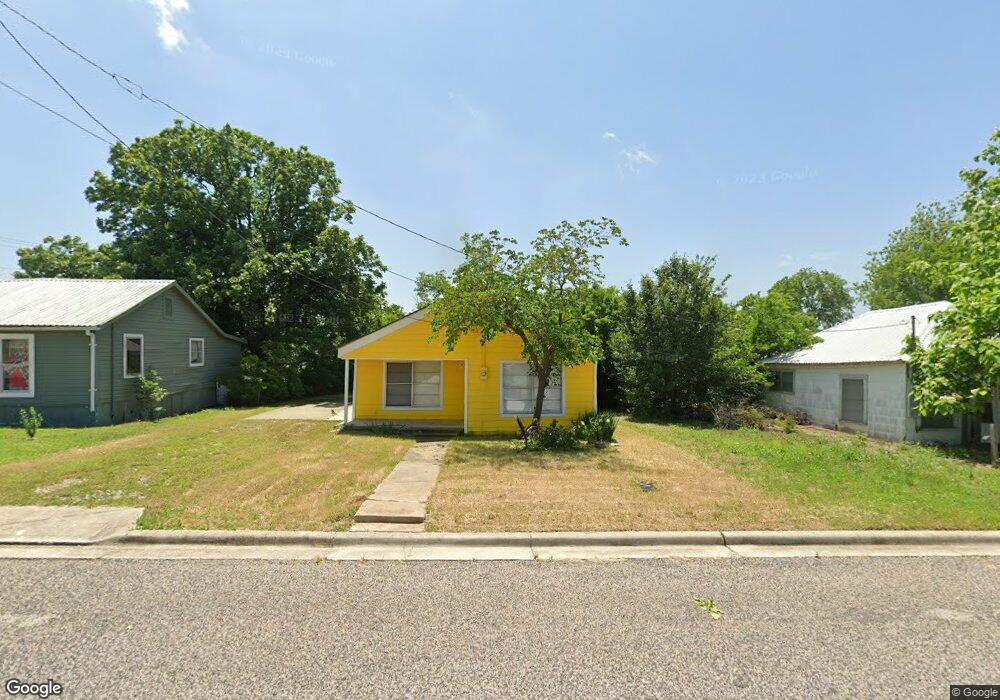
602 Water St Whitesboro, TX 76273
Estimated Value: $109,000 - $129,874
--
Bed
--
Bath
753
Sq Ft
$159/Sq Ft
Est. Value
About This Home
This home is located at 602 Water St, Whitesboro, TX 76273 and is currently estimated at $119,437, approximately $158 per square foot. 602 Water St is a home located in Grayson County with nearby schools including J.W. Hayes Primary School, Whitesboro Intermediate School, and Whitesboro Middle School.
Ownership History
Date
Name
Owned For
Owner Type
Purchase Details
Closed on
Nov 19, 2018
Sold by
Minkel David R
Bought by
Addison Max Ryan
Current Estimated Value
Purchase Details
Closed on
Mar 28, 2008
Sold by
All Service Realty Llc
Bought by
Minkel David R
Home Financials for this Owner
Home Financials are based on the most recent Mortgage that was taken out on this home.
Original Mortgage
$27,000
Interest Rate
6.5%
Mortgage Type
Purchase Money Mortgage
Purchase Details
Closed on
Jul 20, 2007
Sold by
Vaughan Wilbur and Vaughan Barbara A
Bought by
All Services Realty Llc
Create a Home Valuation Report for This Property
The Home Valuation Report is an in-depth analysis detailing your home's value as well as a comparison with similar homes in the area
Home Values in the Area
Average Home Value in this Area
Purchase History
| Date | Buyer | Sale Price | Title Company |
|---|---|---|---|
| Addison Max Ryan | -- | None Available | |
| Minkel David R | -- | Security Title | |
| All Services Realty Llc | -- | None Available |
Source: Public Records
Mortgage History
| Date | Status | Borrower | Loan Amount |
|---|---|---|---|
| Previous Owner | Minkel David R | $27,000 |
Source: Public Records
Tax History Compared to Growth
Tax History
| Year | Tax Paid | Tax Assessment Tax Assessment Total Assessment is a certain percentage of the fair market value that is determined by local assessors to be the total taxable value of land and additions on the property. | Land | Improvement |
|---|---|---|---|---|
| 2025 | $1,815 | $90,198 | $40,950 | $49,248 |
| 2024 | $1,815 | $92,158 | $38,850 | $53,308 |
| 2023 | $1,416 | $78,570 | $38,625 | $39,945 |
| 2022 | $1,454 | $73,755 | $41,250 | $32,505 |
| 2021 | $1,125 | $52,477 | $27,000 | $25,477 |
| 2020 | $1,081 | $48,404 | $22,500 | $25,904 |
| 2019 | $1,001 | $42,644 | $12,600 | $30,044 |
| 2018 | $974 | $40,744 | $12,600 | $28,144 |
| 2017 | $882 | $36,451 | $12,975 | $23,476 |
| 2016 | $752 | $31,063 | $7,125 | $23,938 |
| 2015 | $807 | $32,912 | $7,125 | $25,787 |
| 2014 | $733 | $29,877 | $7,125 | $22,752 |
Source: Public Records
Map
Nearby Homes