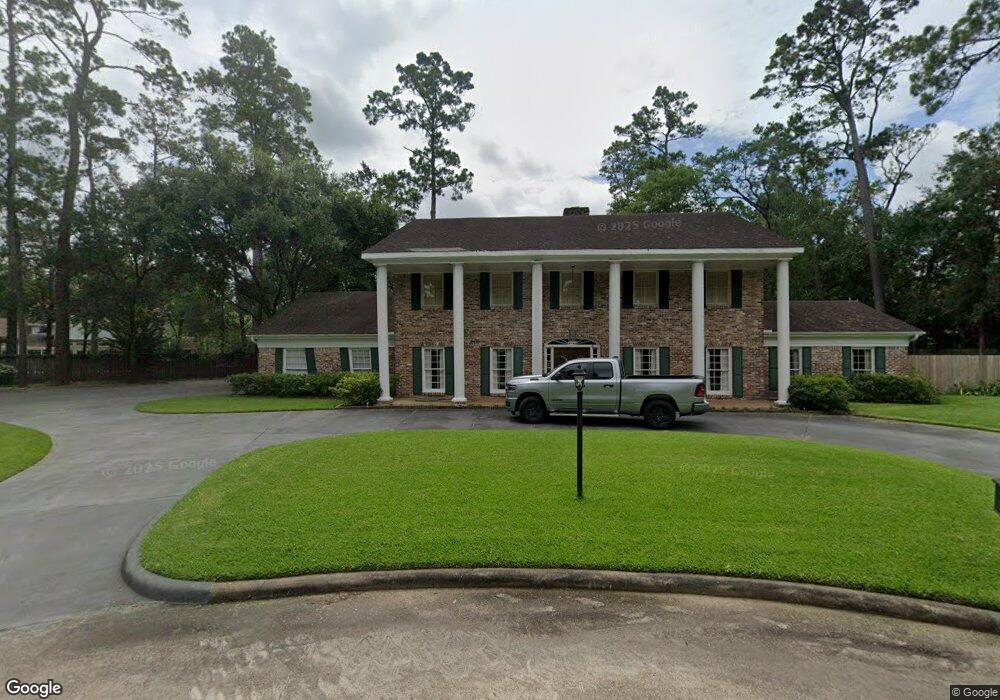
602 Willowgren Dr Houston, TX 77024
Estimated Value: $2,530,030 - $2,627,000
5
Beds
5
Baths
5,301
Sq Ft
$486/Sq Ft
Est. Value
About This Home
This home is located at 602 Willowgren Dr, Houston, TX 77024 and is currently estimated at $2,574,677, approximately $485 per square foot. 602 Willowgren Dr is a home located in Harris County with nearby schools including Bunker Hill Elementary School, Memorial Middle, and Memorial High School.
Ownership History
Date
Name
Owned For
Owner Type
Purchase Details
Closed on
Aug 28, 2002
Sold by
Lewis Mattie R
Bought by
Powell Dorothy M Tucker
Current Estimated Value
Purchase Details
Closed on
Jun 10, 2002
Sold by
Powell Dorothy
Bought by
Goodrum Rick
Home Financials for this Owner
Home Financials are based on the most recent Mortgage that was taken out on this home.
Original Mortgage
$6,000
Interest Rate
6.41%
Mortgage Type
Seller Take Back
Purchase Details
Closed on
Oct 26, 1999
Sold by
Hockmeyer George R
Bought by
Moore Joe F and Moore Therese L
Home Financials for this Owner
Home Financials are based on the most recent Mortgage that was taken out on this home.
Original Mortgage
$240,000
Interest Rate
7.85%
Purchase Details
Closed on
Feb 2, 1999
Sold by
Powell Jesse and Powell Dorothy M
Bought by
Perry Lisa
Purchase Details
Closed on
May 2, 1998
Sold by
Highlands Greater St Lukes Baptist Churc
Bought by
Powell Dorothy M
Create a Home Valuation Report for This Property
The Home Valuation Report is an in-depth analysis detailing your home's value as well as a comparison with similar homes in the area
Home Values in the Area
Average Home Value in this Area
Purchase History
| Date | Buyer | Sale Price | Title Company |
|---|---|---|---|
| Powell Dorothy M Tucker | -- | -- | |
| Goodrum Rick | -- | -- | |
| Moore Joe F | -- | -- | |
| Perry Lisa | -- | -- | |
| Powell Dorothy M | -- | -- |
Source: Public Records
Mortgage History
| Date | Status | Borrower | Loan Amount |
|---|---|---|---|
| Previous Owner | Goodrum Rick | $6,000 | |
| Previous Owner | Moore Joe F | $240,000 |
Source: Public Records
Tax History Compared to Growth
Tax History
| Year | Tax Paid | Tax Assessment Tax Assessment Total Assessment is a certain percentage of the fair market value that is determined by local assessors to be the total taxable value of land and additions on the property. | Land | Improvement |
|---|---|---|---|---|
| 2025 | $25,969 | $2,317,160 | $1,615,710 | $701,450 |
| 2024 | $25,969 | $2,167,184 | $1,561,853 | $605,331 |
| 2023 | $25,969 | $2,150,682 | $1,481,068 | $669,614 |
| 2022 | $42,659 | $2,051,647 | $1,481,068 | $570,579 |
| 2021 | $41,428 | $1,912,945 | $1,400,282 | $512,663 |
| 2020 | $40,998 | $1,851,191 | $1,400,282 | $450,909 |
| 2019 | $41,970 | $1,897,284 | $1,400,282 | $497,002 |
| 2018 | $7,389 | $1,654,106 | $1,400,282 | $253,824 |
| 2017 | $38,155 | $1,654,106 | $1,400,282 | $253,824 |
| 2016 | $36,324 | $1,750,000 | $1,400,282 | $349,718 |
| 2015 | $24,612 | $1,800,000 | $1,400,282 | $399,718 |
| 2014 | $24,612 | $1,518,748 | $1,211,783 | $306,965 |
Source: Public Records
Map
Nearby Homes
- 711 Timber Hill Dr
- 727 Bunker Hill Rd Unit 36
- 727 Bunker Hill Rd Unit 43
- 11910 Heritage Ln
- 12 Gage Ct
- 11721 Spriggs Way
- 827 Bunker Hill Rd
- 11729 Joan of Arc Dr
- 11801 Barryknoll Ln
- 7 Leisure Ln
- 11905 Barryknoll Ln
- 902 Memorial Village Dr Unit 66
- 11933 Barryknoll Ln
- 939 Memorial Village Dr Unit 38
- 835 Merridel Rd
- 11730 Denise Dr
- 11607 Barazi Oaks Ct
- 12126 Kimberley Ln
- 2 Blalock Pines Ct
- 345 Knipp Rd
- 606 Willowgren Dr
- 83 Williamsburg Ln
- 79 Williamsburg Ln
- 87 Williamsburg Ln
- 603 Willowgren Dr
- 607 Willowgren Dr
- 11823 Village Park Cir
- 11827 Village Park Cir
- 11819 Village Park Cir
- 75 Williamsburg Ln
- 11831 Village Park Cir
- 622 Knipp Rd
- 11802 Village Park Cir
- 11846 Village Park Cir
- 638 Knipp Rd
- 11838 Brandywine Ln
- 642 Knipp Rd
- 634 Knipp Rd
- 90 Williamsburg Ln
- 11806 Village Park Cir