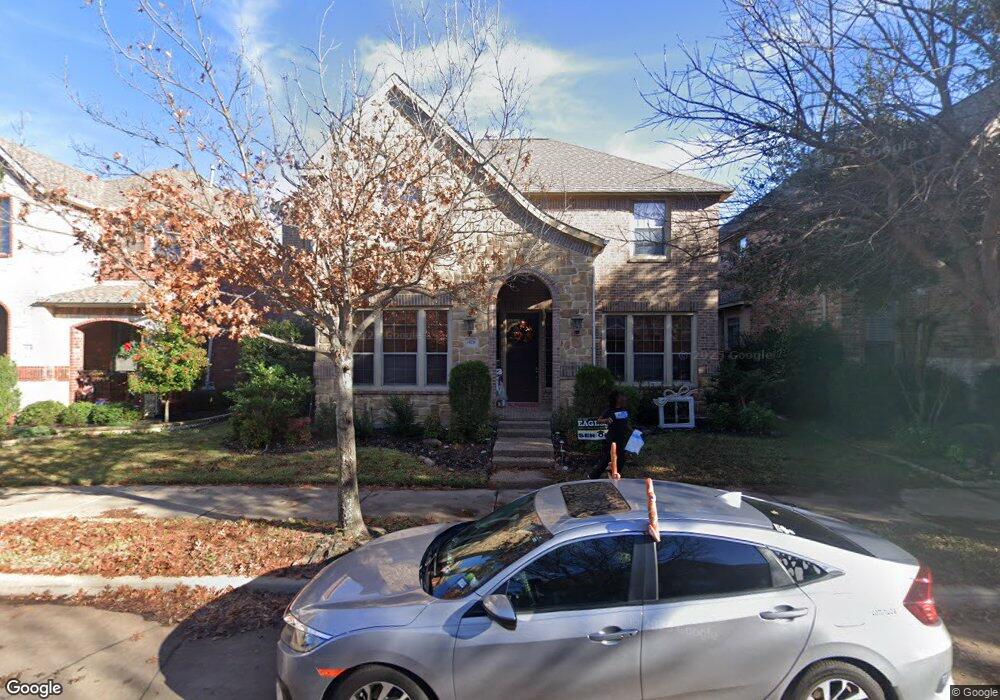
6020 Pedernales Ridge North Richland Hills, TX 76180
Estimated Value: $564,582 - $725,000
5
Beds
4
Baths
3,565
Sq Ft
$175/Sq Ft
Est. Value
About This Home
This home is located at 6020 Pedernales Ridge, North Richland Hills, TX 76180 and is currently estimated at $625,146, approximately $175 per square foot. 6020 Pedernales Ridge is a home located in Tarrant County with nearby schools including Walker Creek Elementary School, Smithfield Middle School, and Birdville High School.
Ownership History
Date
Name
Owned For
Owner Type
Purchase Details
Closed on
Oct 3, 2011
Sold by
Lowe Martin and Lowe Paige
Bought by
Leist Russell and Leist Ann Marie
Current Estimated Value
Home Financials for this Owner
Home Financials are based on the most recent Mortgage that was taken out on this home.
Original Mortgage
$208,800
Outstanding Balance
$143,640
Interest Rate
4.28%
Mortgage Type
New Conventional
Estimated Equity
$481,506
Purchase Details
Closed on
Mar 30, 2005
Sold by
Goodman Family Of Builders Lp
Bought by
Lowe Martin and Lowe Paige
Home Financials for this Owner
Home Financials are based on the most recent Mortgage that was taken out on this home.
Original Mortgage
$225,950
Interest Rate
5.71%
Mortgage Type
Purchase Money Mortgage
Create a Home Valuation Report for This Property
The Home Valuation Report is an in-depth analysis detailing your home's value as well as a comparison with similar homes in the area
Home Values in the Area
Average Home Value in this Area
Purchase History
| Date | Buyer | Sale Price | Title Company |
|---|---|---|---|
| Leist Russell | -- | Rtt | |
| Lowe Martin | -- | Hexter Fair Title Company |
Source: Public Records
Mortgage History
| Date | Status | Borrower | Loan Amount |
|---|---|---|---|
| Open | Leist Russell | $208,800 | |
| Previous Owner | Lowe Martin | $225,950 | |
| Closed | Lowe Martin | $28,250 |
Source: Public Records
Tax History Compared to Growth
Tax History
| Year | Tax Paid | Tax Assessment Tax Assessment Total Assessment is a certain percentage of the fair market value that is determined by local assessors to be the total taxable value of land and additions on the property. | Land | Improvement |
|---|---|---|---|---|
| 2025 | $8,770 | $504,000 | $45,730 | $458,270 |
| 2024 | $8,770 | $538,941 | $45,730 | $493,211 |
| 2023 | $9,954 | $510,821 | $45,730 | $465,091 |
| 2022 | $9,927 | $418,162 | $45,730 | $372,432 |
| 2021 | $9,543 | $375,027 | $75,000 | $300,027 |
| 2020 | $9,543 | $375,027 | $75,000 | $300,027 |
| 2019 | $9,876 | $375,027 | $75,000 | $300,027 |
| 2018 | $9,029 | $368,960 | $75,000 | $293,960 |
| 2017 | $9,025 | $335,418 | $75,000 | $260,418 |
| 2016 | $8,606 | $348,623 | $50,000 | $298,623 |
| 2015 | $7,331 | $290,800 | $35,000 | $255,800 |
| 2014 | $7,331 | $307,000 | $35,000 | $272,000 |
Source: Public Records
Map
Nearby Homes
- 8020 Bridge St
- 5920 Pedernales Ridge
- 6017 Avalon St
- 8240 Bridge St
- 8057 Caladium Dr
- 6113 Cliffbrook Dr
- 7800 Mockingbird Ln Unit 29
- 7800 Mockingbird Ln Unit 81
- 7800 Mockingbird Ln Unit 73
- 7800 Mockingbird Ln Unit 43
- 7800 Mockingbird Ln Unit 205
- 7713 Deaver Dr
- 6250 Shirley Dr
- 7704 Terry Dr
- 8321 Bridge St
- 7457 N College Cir
- 7632 Terry Dr
- 0 Mid Cities Blvd
- 7609 Deaver Dr
- 7696 Resting Mews Ln
- 6016 Pedernales Ridge
- 6024 Pedernales Ridge
- 6012 Pedernales Ridge
- 6028 Pedernales Ridge
- 6017 Cripple Creek Trail
- 6021 Cripple Creek Trail
- 6013 Cripple Creek Trail
- 6008 Pedernales Ridge
- 6032 Pedernales Ridge
- 6021 Pedernales Ridge
- 6025 Pedernales Ridge
- 6025 Cripple Creek Trail
- 6017 Pedernales Ridge
- 6029 Pedernales Ridge
- 6009 Cripple Creek Trail
- 6004 Pedernales Ridge
- 6013 Pedernales Ridge
- 6029 Cripple Creek Trail
- 6033 Pedernales Ridge
- 6009 Pedernales Ridge