Estimated Value: $237,000 - $289,097
--
Bed
--
Bath
1,500
Sq Ft
$180/Sq Ft
Est. Value
About This Home
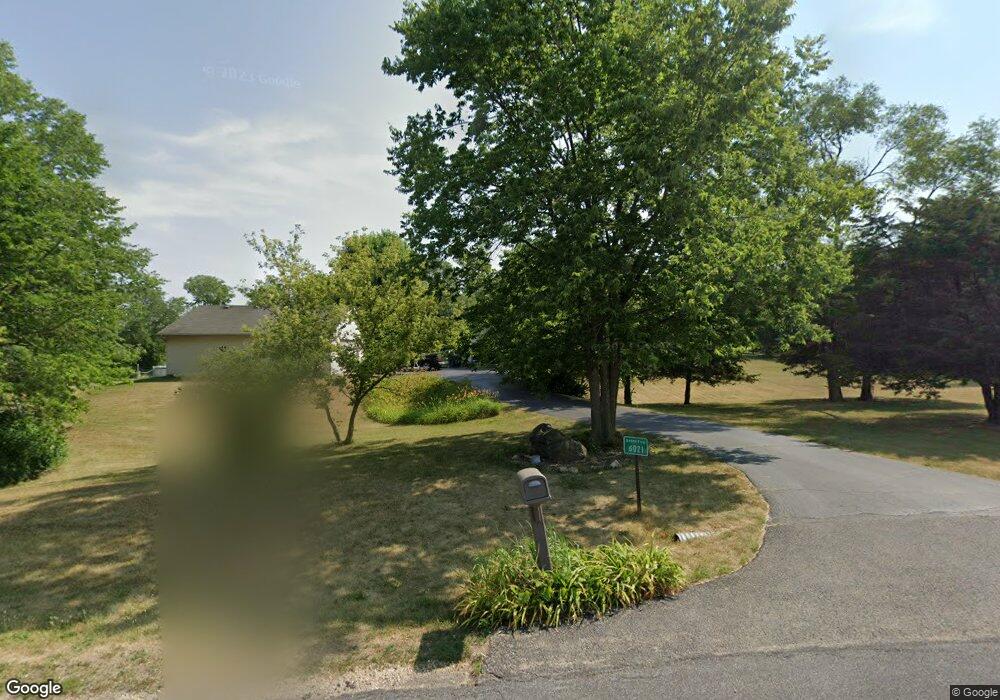
This home is located at 6021 N Cl Myers Dr, Byron, IL 61010 and is currently estimated at $270,024, approximately $180 per square foot. 6021 N Cl Myers Dr is a home located in Ogle County with nearby schools including Mary Morgan Elementary School, Byron Middle School, and Byron High School.
Ownership History
Date
Name
Owned For
Owner Type
Purchase Details
Closed on
Sep 24, 2015
Sold by
Shaw David A and Shaw Lisa A
Bought by
Burle Nicholas R and Burle Nancy M
Current Estimated Value
Home Financials for this Owner
Home Financials are based on the most recent Mortgage that was taken out on this home.
Original Mortgage
$203,850
Outstanding Balance
$162,051
Interest Rate
4.27%
Mortgage Type
New Conventional
Estimated Equity
$107,973
Purchase Details
Closed on
Apr 11, 2011
Sold by
Barry Tim A and Sauk Valley Bank & Trust Co
Bought by
Shaw David A and Shaw Lisa A
Home Financials for this Owner
Home Financials are based on the most recent Mortgage that was taken out on this home.
Original Mortgage
$128,254
Interest Rate
4.77%
Mortgage Type
Future Advance Clause Open End Mortgage
Create a Home Valuation Report for This Property
The Home Valuation Report is an in-depth analysis detailing your home's value as well as a comparison with similar homes in the area
Home Values in the Area
Average Home Value in this Area
Purchase History
| Date | Buyer | Sale Price | Title Company |
|---|---|---|---|
| Burle Nicholas R | $113,253 | -- | |
| Shaw David A | $128,255 | None Available |
Source: Public Records
Mortgage History
| Date | Status | Borrower | Loan Amount |
|---|---|---|---|
| Open | Burle Nicholas R | $203,850 | |
| Previous Owner | Shaw David A | $128,254 |
Source: Public Records
Tax History Compared to Growth
Tax History
| Year | Tax Paid | Tax Assessment Tax Assessment Total Assessment is a certain percentage of the fair market value that is determined by local assessors to be the total taxable value of land and additions on the property. | Land | Improvement |
|---|---|---|---|---|
| 2024 | $6,011 | $90,924 | $17,643 | $73,281 |
| 2023 | $5,340 | $83,059 | $16,117 | $66,942 |
| 2022 | $5,116 | $79,118 | $15,352 | $63,766 |
| 2021 | $5,138 | $77,316 | $15,002 | $62,314 |
| 2020 | $4,517 | $73,846 | $14,329 | $59,517 |
| 2019 | $4,504 | $70,836 | $13,745 | $57,091 |
| 2018 | $4,613 | $70,836 | $13,745 | $57,091 |
| 2017 | $4,328 | $68,197 | $13,233 | $54,964 |
| 2016 | $4,225 | $67,196 | $13,039 | $54,157 |
| 2015 | $3,708 | $60,536 | $12,746 | $47,790 |
| 2014 | $3,339 | $60,536 | $12,746 | $47,790 |
| 2013 | $2,963 | $56,808 | $12,382 | $44,426 |
Source: Public Records
Map
Nearby Homes
- 1260 E Old Wagon Rd
- 1260 Old Wagon Rd
- 265 Creekside Dr
- 309 Creekside Dr
- 0 N Il Rt 2 Unit 202506208
- 0 N Il Rt 2 Unit MRD12481307
- 0 N Il Rt 2 Unit 25126463
- 815 Hampton Dr
- 503 W 2nd St
- 401 W 3rd St
- 1101 E Spring Creek Rd
- 423 W 4th St
- 8890 Hales Corner Rd Rd
- 1245 Glacier Dr
- 1257 Glacier Dr
- 521 N Walnut St
- 429 N Union St
- 1368 Joanne Terrace
- 8692 Glacier Dr
- 5166 E Hubbard Trail
- 6001 N Cl Myers Dr
- 6016 N Esther Dr
- 000 N Kathryn Rd
- 5977 N Cl Myers Dr
- 5991 N Esther Dr
- 5947 N Cl Myers Dr
- 5956 N Cl Myers Dr
- 5965 N Esther Dr
- 5907 N Cl Myers Dr
- 6185 N River Rd
- 5939 N Esther Dr
- 5886 N Cl Myers Dr
- 5913 N Esther Dr
- 5857 N Cl Myers Dr
- 5887 N Esther Dr
- 6263 N River Dr
- 6247 N River Dr
- 6279 N River Dr
- 6233 N River Dr
- 6287 N River Dr