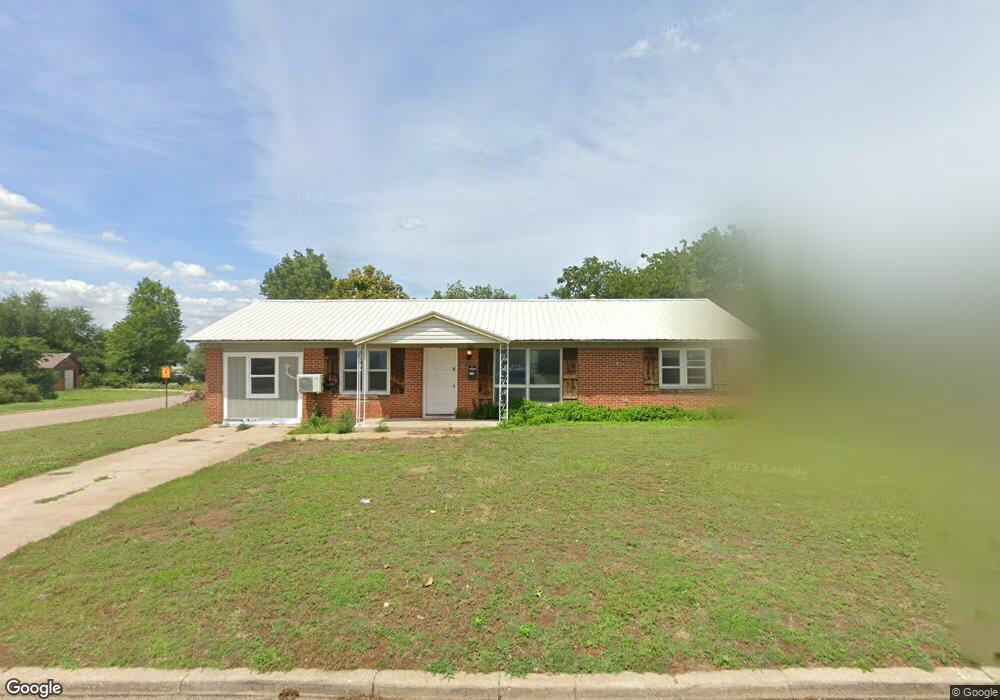
6021 NW 60th St Oklahoma City, OK 73122
Estimated Value: $124,000 - $147,000
4
Beds
2
Baths
1,375
Sq Ft
$97/Sq Ft
Est. Value
About This Home
This home is located at 6021 NW 60th St, Oklahoma City, OK 73122 and is currently estimated at $133,012, approximately $96 per square foot. 6021 NW 60th St is a home located in Oklahoma County with nearby schools including Central Elementary School, James L. Capps Middle School, and Putnam City High School.
Ownership History
Date
Name
Owned For
Owner Type
Purchase Details
Closed on
Sep 29, 2022
Sold by
Hulson Revocable Trust
Bought by
Tbh Family Trust
Current Estimated Value
Purchase Details
Closed on
Aug 26, 2021
Sold by
Crouch Noah and Estate Of Sarah Ruth Crouch
Bought by
Legacy Investment Holdings Llc
Home Financials for this Owner
Home Financials are based on the most recent Mortgage that was taken out on this home.
Original Mortgage
$101,250
Interest Rate
2.7%
Mortgage Type
Future Advance Clause Open End Mortgage
Purchase Details
Closed on
Aug 25, 2021
Sold by
Legacy Investment Holdings Llc
Bought by
Alchemy Investments Llc
Home Financials for this Owner
Home Financials are based on the most recent Mortgage that was taken out on this home.
Original Mortgage
$101,250
Interest Rate
2.7%
Mortgage Type
Future Advance Clause Open End Mortgage
Purchase Details
Closed on
Mar 20, 2019
Sold by
Smith Frank and Smith Revocable Livin Ronald C
Bought by
Crouch Sarah
Create a Home Valuation Report for This Property
The Home Valuation Report is an in-depth analysis detailing your home's value as well as a comparison with similar homes in the area
Home Values in the Area
Average Home Value in this Area
Purchase History
| Date | Buyer | Sale Price | Title Company |
|---|---|---|---|
| Tbh Family Trust | -- | -- | |
| Legacy Investment Holdings Llc | $67,000 | Oklahoma City Abstract & Ttl | |
| Alchemy Investments Llc | $93,000 | Oklahoma City Abstract & Ttl | |
| Crouch Sarah | -- | None Available |
Source: Public Records
Mortgage History
| Date | Status | Borrower | Loan Amount |
|---|---|---|---|
| Previous Owner | Alchemy Investments Llc | $101,250 |
Source: Public Records
Tax History Compared to Growth
Tax History
| Year | Tax Paid | Tax Assessment Tax Assessment Total Assessment is a certain percentage of the fair market value that is determined by local assessors to be the total taxable value of land and additions on the property. | Land | Improvement |
|---|---|---|---|---|
| 2024 | $1,320 | $11,763 | $2,744 | $9,019 |
| 2023 | $1,320 | $11,203 | $2,008 | $9,195 |
| 2022 | $1,285 | $10,670 | $2,109 | $8,561 |
| 2021 | $1,203 | $10,048 | $2,083 | $7,965 |
| 2020 | $1,149 | $9,570 | $2,109 | $7,461 |
| 2019 | $1,094 | $9,185 | $1,952 | $7,233 |
| 2018 | $931 | $8,910 | $0 | $0 |
| 2017 | $903 | $8,604 | $1,921 | $6,683 |
| 2016 | $862 | $8,194 | $1,952 | $6,242 |
| 2015 | $913 | $8,623 | $2,885 | $5,738 |
| 2014 | $862 | $8,506 | $2,885 | $5,621 |
Source: Public Records
Map
Nearby Homes
- 6005 NW 58th Terrace
- 5900 NW 62nd St
- 5936 N Ione Dr
- 6605 Willowridge Dr
- 6013 NW 55th St
- 5636 NW 58th Terrace
- 6712 NW 61st St
- 5709 NW 64th St
- 5932 N Grove Ave
- 6031 NW 53rd Terrace
- 6414 Galaxie Terrace
- 6805 NW 64th Terrace Unit 6
- 6203 NW 53rd St Unit 48
- 6500 N Grove Ave
- 6815 NW 64th Terrace Unit 1
- 6911 NW 59th Terrace
- 6208 W Gun Hill Way
- 7007 NW 61st St
- 7012 NW 62nd St
- 5905 NW 50th St
- 6104 N Redmond Ct
- 6017 NW 60th St
- 6108 N Redmond Ct
- 6020 NW 60th St
- 6024 NW 60th St
- 6013 NW 60th St
- 6033 NW 60th St
- 6016 NW 60th St
- 6028 NW 60th St
- 6107 N Redmond Ct
- 6205 N Hammond Ave
- 6012 NW 60th St
- 6209 N Hammond Ave
- 6201 N Hammond Ave
- 6032 NW 60th St
- 6111 N Redmond Ct
- 6213 N Hammond Ave
- 6001 NW 60th St
- 6008 NW 60th St
- 6037 NW 60th St