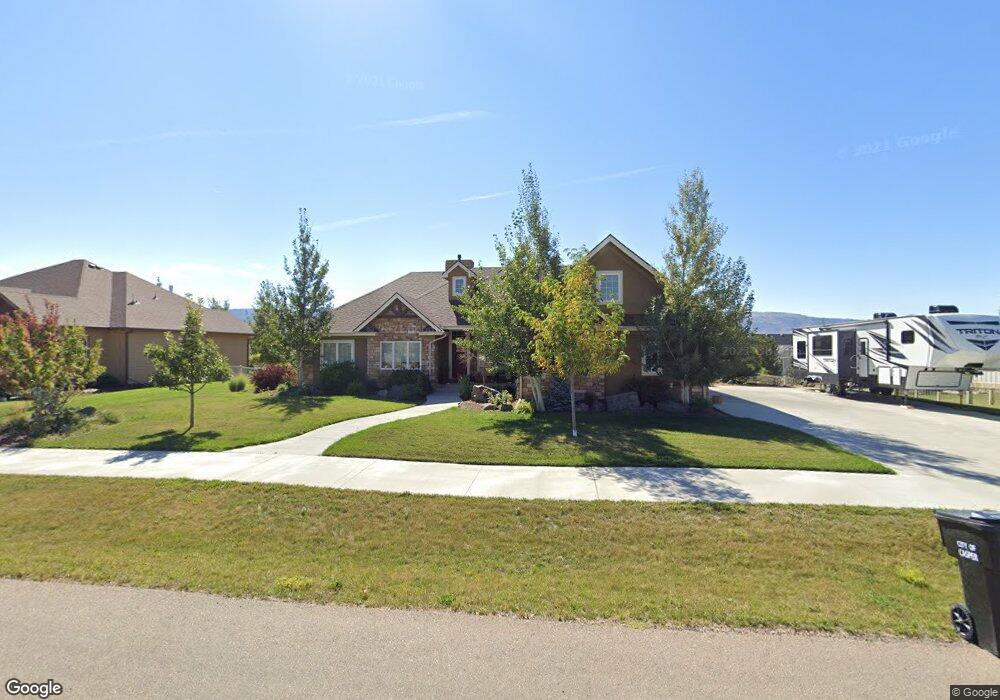
6021 Rivers Gate Unit Robertson Rd Casper, WY 82604
Estimated Value: $786,000 - $868,788
5
Beds
4
Baths
4,642
Sq Ft
$179/Sq Ft
Est. Value
About This Home
This home is located at 6021 Rivers Gate Unit Robertson Rd, Casper, WY 82604 and is currently estimated at $830,263, approximately $178 per square foot. 6021 Rivers Gate Unit Robertson Rd is a home located in Natrona County with nearby schools including Paradise Valley Christian School.
Ownership History
Date
Name
Owned For
Owner Type
Purchase Details
Closed on
Jun 13, 2023
Sold by
Nester David W and Nester Casey R
Bought by
Wingerter Joseph G and Wingerter Lori A
Current Estimated Value
Home Financials for this Owner
Home Financials are based on the most recent Mortgage that was taken out on this home.
Original Mortgage
$526,000
Outstanding Balance
$511,935
Interest Rate
6.39%
Mortgage Type
New Conventional
Estimated Equity
$318,328
Purchase Details
Closed on
Dec 28, 2021
Sold by
Babcock Family Trust
Bought by
Lance John Il and Lance Kim J
Purchase Details
Closed on
Jun 5, 2019
Sold by
Lance John and Lance Kimberly
Bought by
Nester David W and Nester Casey R
Purchase Details
Closed on
Dec 9, 2013
Bought by
Lance John
Purchase Details
Closed on
May 3, 2013
Sold by
Rp Development Llc
Bought by
River Valley Builders Inc
Create a Home Valuation Report for This Property
The Home Valuation Report is an in-depth analysis detailing your home's value as well as a comparison with similar homes in the area
Home Values in the Area
Average Home Value in this Area
Purchase History
| Date | Buyer | Sale Price | Title Company |
|---|---|---|---|
| Wingerter Joseph G | -- | American Title Agency | |
| Lance John Il | -- | None Listed On Document | |
| Nester David W | -- | Rockmountain Title | |
| Lance John | -- | -- | |
| River Valley Builders Inc | -- | -- |
Source: Public Records
Mortgage History
| Date | Status | Borrower | Loan Amount |
|---|---|---|---|
| Open | Wingerter Joseph G | $526,000 |
Source: Public Records
Tax History Compared to Growth
Tax History
| Year | Tax Paid | Tax Assessment Tax Assessment Total Assessment is a certain percentage of the fair market value that is determined by local assessors to be the total taxable value of land and additions on the property. | Land | Improvement |
|---|---|---|---|---|
| 2025 | $4,017 | $55,940 | $3,780 | $52,160 |
| 2024 | $5,588 | $77,819 | $4,846 | $72,973 |
| 2023 | $5,043 | $69,188 | $7,327 | $61,861 |
| 2022 | $4,901 | $67,245 | $9,050 | $58,195 |
| 2021 | $4,301 | $59,012 | $11,737 | $47,275 |
| 2020 | $5,085 | $69,769 | $27,125 | $42,644 |
| 2019 | $3,517 | $48,253 | $5,380 | $42,873 |
| 2018 | $3,594 | $49,313 | $5,380 | $43,933 |
| 2017 | $3,610 | $49,522 | $5,380 | $44,142 |
| 2015 | $3,741 | $51,327 | $6,391 | $44,936 |
| 2014 | $3,541 | $48,581 | $6,391 | $42,189 |
Source: Public Records
Map
Nearby Homes
- 6002 River Park Dr
- 6060 Rivers Gate
- 142 Indian Paintbrush St
- 1664 Begonia St
- 46 Lilac St
- 6395 Little Moon Trail
- 291 Indian Paintbrush St
- 91 Magnolia St
- 2924 Herrington Dr
- 6622 Cherokee Ln
- 2986 Herrington Dr
- 36 Magnolia St
- 210 Daffodil St
- 0 Robertson Rd
- 3056 Herrington Dr
- 6521 Blue Springs Rd
- 3075 Cold Springs Rd
- 6381 Pittman Cir
- 363 Oleander St
- 0 Boles Rd
- 6021 Rivers Gate
- 6001 Rivers Gate
- 6031 Rivers Gate
- 6042 River Park Dr
- 6020 Rivers Gate Unit River Park Drive
- 6020 Rivers Gate
- 6041 Rivers Gate
- 5981 Rivers Gate
- 6000 Rivers Gate
- 6040 Rivers Gate
- 6062 River Park Dr
- 6061 River's Gate Dr
- 5980 Rivers Gate
- 6061 Rivers Gate
- 6082 River Park Dr
- 6025 River Park Dr
- 6025 River Park Dr Unit Robertson Road
- 6025 River Park Dr Unit River's Gate
- 5989 River Park Dr
- 6013 River Park Dr