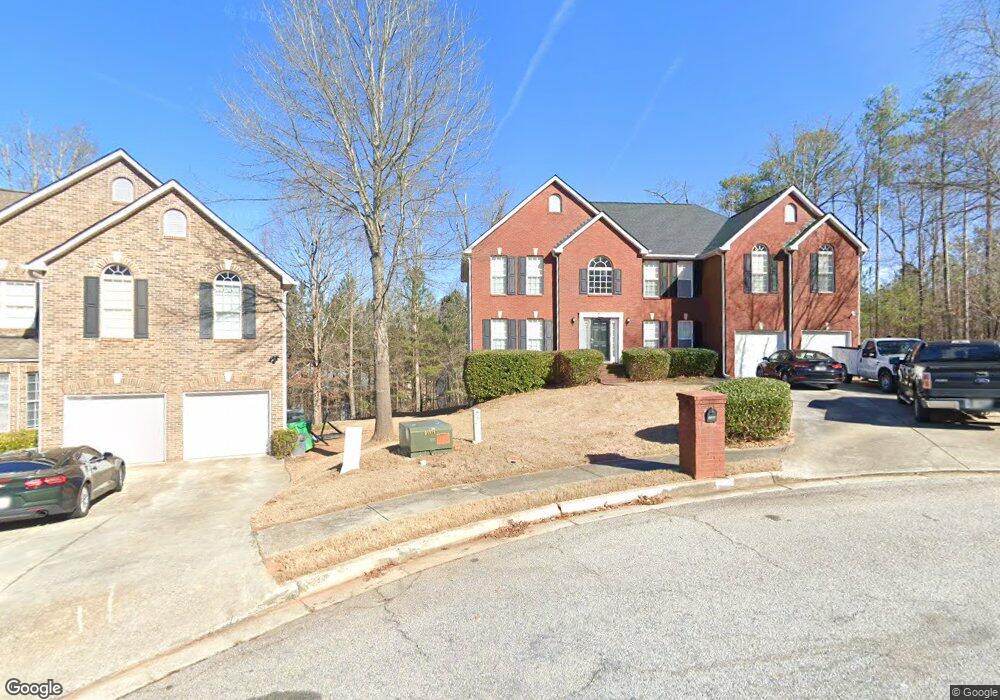
6022 Springfair Run Lithonia, GA 30038
Estimated Value: $348,083 - $440,000
5
Beds
4
Baths
3,048
Sq Ft
$128/Sq Ft
Est. Value
About This Home
This home is located at 6022 Springfair Run, Lithonia, GA 30038 and is currently estimated at $390,271, approximately $128 per square foot. 6022 Springfair Run is a home located in DeKalb County with nearby schools including Flat Rock Elementary School, Lithonia Middle School, and Lithonia High School.
Ownership History
Date
Name
Owned For
Owner Type
Purchase Details
Closed on
Nov 22, 2011
Sold by
Floyd Jessika Cornwell
Bought by
Floyd Desmond Deante
Current Estimated Value
Purchase Details
Closed on
Mar 11, 2008
Sold by
Fnma
Bought by
Floyd Desmond and Floyd Jessika
Home Financials for this Owner
Home Financials are based on the most recent Mortgage that was taken out on this home.
Original Mortgage
$227,500
Interest Rate
5.97%
Mortgage Type
New Conventional
Purchase Details
Closed on
Sep 6, 2005
Sold by
Netbank
Bought by
Federal National Mtg Associati
Purchase Details
Closed on
Aug 13, 2003
Sold by
Eastland Homes Inc
Bought by
Adams Sill B
Home Financials for this Owner
Home Financials are based on the most recent Mortgage that was taken out on this home.
Original Mortgage
$238,000
Interest Rate
5.75%
Mortgage Type
New Conventional
Create a Home Valuation Report for This Property
The Home Valuation Report is an in-depth analysis detailing your home's value as well as a comparison with similar homes in the area
Home Values in the Area
Average Home Value in this Area
Purchase History
| Date | Buyer | Sale Price | Title Company |
|---|---|---|---|
| Floyd Desmond Deante | -- | -- | |
| Floyd Desmond | $227,500 | -- | |
| Federal National Mtg Associati | -- | -- | |
| Netbank | $244,339 | -- | |
| Adams Sill B | $238,000 | -- |
Source: Public Records
Mortgage History
| Date | Status | Borrower | Loan Amount |
|---|---|---|---|
| Previous Owner | Floyd Desmond | $227,500 | |
| Previous Owner | Adams Sill B | $238,000 |
Source: Public Records
Tax History
| Year | Tax Paid | Tax Assessment Tax Assessment Total Assessment is a certain percentage of the fair market value that is determined by local assessors to be the total taxable value of land and additions on the property. | Land | Improvement |
|---|---|---|---|---|
| 2025 | $4,159 | $146,000 | $20,000 | $126,000 |
| 2024 | $4,494 | $156,440 | $20,000 | $136,440 |
| 2023 | $4,494 | $150,840 | $20,000 | $130,840 |
Source: Public Records
Map
Nearby Homes
- 5769 Fairington Farms Ct
- 2966 Fairton Trail
- 3003 Fairing Hill
- 3237 Fairington Dr
- 3229 Fairington Dr Unit 3229
- 3215 Fairington Dr
- 5903 Springs Way
- 3221 Fairington Dr
- 6061 Spring Way
- 6048 Spring Way
- 6014 Spring Way
- 3119 Fairington Dr
- 3109 Fairington Dr
- 5840 Par Four Ct
- 5820 Par Four Ct
- 8201 Par Four Way Unit 8201
- 3095 Bonnes Dr
- 5843 Taka Ln
- 5796 Par Four Ct
- 5303 Par Four Way Unit 5303
- 6027 Springfair Run Unit 1
- 6016 Springfair Run
- 6037 Fairington Farms Ln
- 6031 Fairington Farms Ln
- 6043 Fairington Farms Ln
- 6025 Fairington Farms Ln
- 6008 Springfair Run
- 6023 Springfair Run
- 5770 Fairington Farms Ct
- 5765 Fairington Farms Ct
- 6017 Springfair Run
- 6049 Fairington Farms Ln
- 6019 Fairington Farms Ln
- 6000 Springfair Run Unit 1
- 6009 Springfair Run
- 6055 Fairington Farms Ln
- 6013 Fairington Farms Ln
- 6001 Springfair Run
- 6036 Fairington Farms Ln
- 6030 Fairington Farms Ln
Your Personal Tour Guide
Ask me questions while you tour the home.