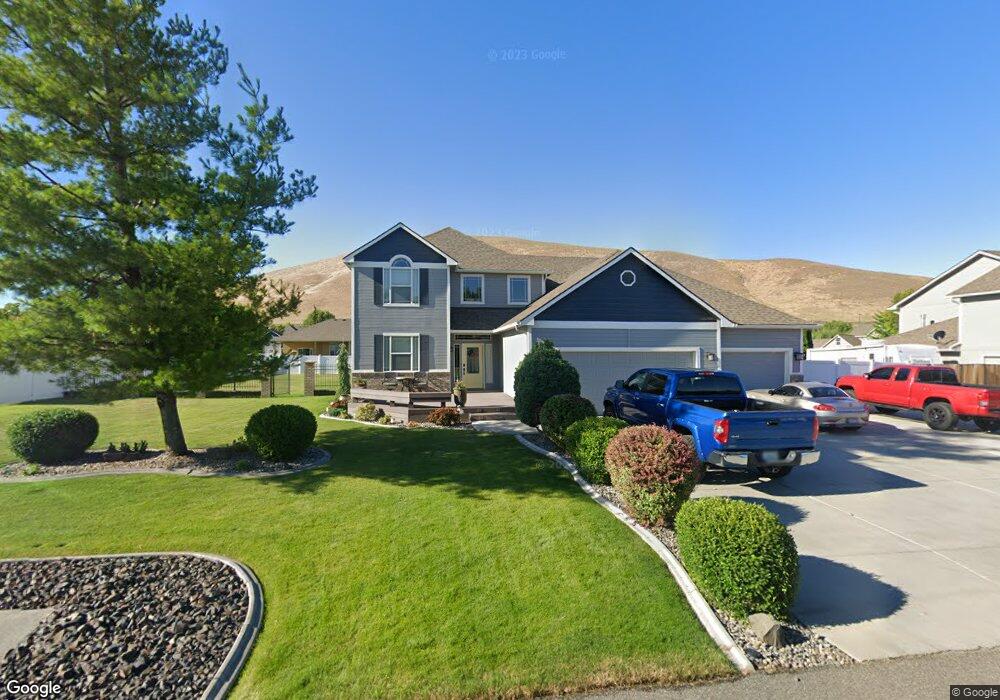
6022 Thynewood Loop West Richland, WA 99353
Estimated Value: $655,540 - $773,000
4
Beds
3
Baths
3,028
Sq Ft
$235/Sq Ft
Est. Value
About This Home
This home is located at 6022 Thynewood Loop, West Richland, WA 99353 and is currently estimated at $711,385, approximately $234 per square foot. 6022 Thynewood Loop is a home located in Benton County with nearby schools including White Bluffs Elementary School, Enterprise Middle School, and Richland High School.
Ownership History
Date
Name
Owned For
Owner Type
Purchase Details
Closed on
Aug 19, 2021
Sold by
Duggan Douglas C
Bought by
Duggan Douglas and Duggan Torri J
Current Estimated Value
Home Financials for this Owner
Home Financials are based on the most recent Mortgage that was taken out on this home.
Original Mortgage
$420,000
Outstanding Balance
$381,910
Interest Rate
2.9%
Mortgage Type
New Conventional
Estimated Equity
$329,475
Purchase Details
Closed on
Dec 19, 2012
Sold by
Duggan Torri J
Bought by
Duggan Douglas C
Home Financials for this Owner
Home Financials are based on the most recent Mortgage that was taken out on this home.
Original Mortgage
$272,000
Interest Rate
3.27%
Mortgage Type
New Conventional
Purchase Details
Closed on
Jul 2, 2008
Sold by
Sr Homes Llc
Bought by
Duggan Douglas C and Duggan Torri J
Home Financials for this Owner
Home Financials are based on the most recent Mortgage that was taken out on this home.
Original Mortgage
$279,125
Interest Rate
6%
Mortgage Type
FHA
Create a Home Valuation Report for This Property
The Home Valuation Report is an in-depth analysis detailing your home's value as well as a comparison with similar homes in the area
Home Values in the Area
Average Home Value in this Area
Purchase History
| Date | Buyer | Sale Price | Title Company |
|---|---|---|---|
| Duggan Douglas | -- | Chicago Title | |
| Duggan Douglas C | -- | Stewart Title Co 1 | |
| Duggan Douglas C | $296,600 | Stewart Title Co |
Source: Public Records
Mortgage History
| Date | Status | Borrower | Loan Amount |
|---|---|---|---|
| Open | Duggan Douglas | $420,000 | |
| Closed | Duggan Douglas C | $272,000 | |
| Closed | Duggan Douglas C | $279,125 |
Source: Public Records
Tax History Compared to Growth
Tax History
| Year | Tax Paid | Tax Assessment Tax Assessment Total Assessment is a certain percentage of the fair market value that is determined by local assessors to be the total taxable value of land and additions on the property. | Land | Improvement |
|---|---|---|---|---|
| 2024 | $5,280 | $576,480 | $60,000 | $516,480 |
| 2023 | $5,280 | $497,020 | $60,000 | $437,020 |
| 2022 | $5,148 | $444,050 | $60,000 | $384,050 |
| 2021 | $5,037 | $417,560 | $60,000 | $357,560 |
| 2020 | $4,993 | $391,080 | $60,000 | $331,080 |
| 2019 | $4,691 | $372,170 | $60,000 | $312,170 |
| 2018 | $4,639 | $375,280 | $50,400 | $324,880 |
| 2017 | $4,127 | $321,130 | $50,400 | $270,730 |
| 2016 | $4,358 | $321,130 | $50,400 | $270,730 |
| 2015 | $4,419 | $321,130 | $50,400 | $270,730 |
| 2014 | -- | $321,130 | $50,400 | $270,730 |
| 2013 | -- | $321,130 | $50,400 | $270,730 |
Source: Public Records
Map
Nearby Homes
- 6363 Keene Rd
- 6397 Keene Rd
- 6461 Keene Rd
- 1120 Keene Rd
- 5600 Kirkwood Ln
- 5507 Monica St
- 6062 Juneberry Dr
- 3538 Curtis Dr
- 5258 Chris St
- 6273 Teak Ln
- 6450 Keene Rd
- 6268 Teak Ln
- 3000 S Highlands Blvd
- 5200 S Desert Dove Loop
- 5705 Aspen Dr
- 5506 Aspen Dr
- 5420 Hershey Ln
- 3909 Curtis Dr
- 2512 Hickory Ave
- 5007 S Desert Dove Loop
- 6006 Thynewood Loop
- 6048 Thynewood Loop
- 6048 Thynewood Loop
- 5962 Thynewood Loop Unit READY FOR A 36X45 SH
- 5962 Thynewood Loop Unit .47 OF AN ACRE / R
- 5962 Thynewood Loop
- 6021 Thynewood Loop
- 5990 Thynewood Loop
- 6033 Thynewood Loop
- 5940 Thynewood Loop
- 6060 Thynewood Loop
- 6019 Thynewood Loop
- 6007 Thynewood Loop
- 6017 Willowbend St
- 6001 Thynewood Loop
- 5989 Willowbend St
- 6015 Thynewood Loop
- 5961 Thynewood Loop
- 5918 Thynewood Loop
- 6055 Willowbend St