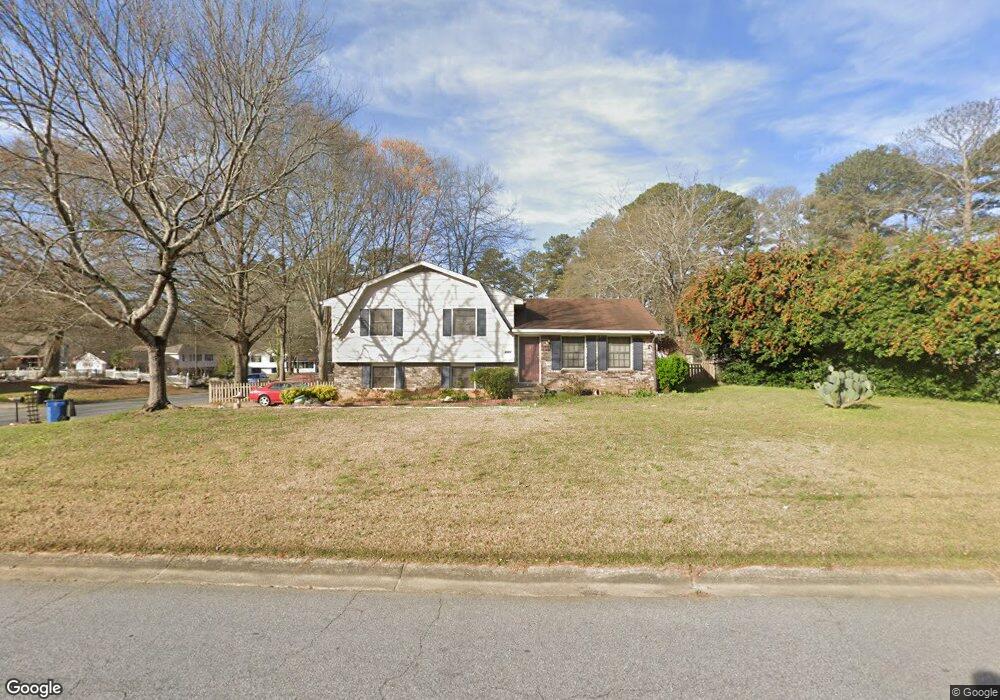
6023 Cristie Dr Ellenwood, GA 30294
Estimated Value: $174,000 - $202,000
3
Beds
2
Baths
1,573
Sq Ft
$119/Sq Ft
Est. Value
About This Home
This home is located at 6023 Cristie Dr, Ellenwood, GA 30294 and is currently estimated at $186,478, approximately $118 per square foot. 6023 Cristie Dr is a home located in Clayton County with nearby schools including Thurgood Marshall Elementary School, Adamson Middle School, and Morrow High School.
Ownership History
Date
Name
Owned For
Owner Type
Purchase Details
Closed on
Oct 31, 2016
Bought by
Le Nga K
Current Estimated Value
Purchase Details
Closed on
May 3, 2016
Sold by
Grooms Eddie
Bought by
The Bank Of New York Mellon Trust Co Na and C/O Ocwen Loan Servicing Llc
Purchase Details
Closed on
Nov 10, 2004
Sold by
Grooms Eddie
Bought by
Kupcuoglu Alp
Purchase Details
Closed on
Dec 3, 2002
Sold by
National City Mtg Co
Bought by
Hud
Purchase Details
Closed on
Jan 12, 2000
Sold by
Gibbs Christopher W and Gibbs Tonya M
Bought by
Pinkney Clara
Home Financials for this Owner
Home Financials are based on the most recent Mortgage that was taken out on this home.
Original Mortgage
$101,164
Interest Rate
7.94%
Mortgage Type
FHA
Purchase Details
Closed on
Jun 29, 1995
Sold by
Gibbs James
Bought by
Gibbs Christopher Tonya
Create a Home Valuation Report for This Property
The Home Valuation Report is an in-depth analysis detailing your home's value as well as a comparison with similar homes in the area
Home Values in the Area
Average Home Value in this Area
Purchase History
| Date | Buyer | Sale Price | Title Company |
|---|---|---|---|
| Le Nga K | $64,044 | -- | |
| The Bank Of New York Mellon Trust Co Na | $71,000 | -- | |
| Kupcuoglu Alp | -- | -- | |
| Hud | -- | -- | |
| National City Mtg Co | $113,138 | -- | |
| Pinkney Clara | $102,600 | -- | |
| Gibbs Christopher Tonya | $66,300 | -- |
Source: Public Records
Mortgage History
| Date | Status | Borrower | Loan Amount |
|---|---|---|---|
| Previous Owner | Pinkney Clara | $101,164 | |
| Closed | Gibbs Christopher Tonya | $0 |
Source: Public Records
Tax History Compared to Growth
Tax History
| Year | Tax Paid | Tax Assessment Tax Assessment Total Assessment is a certain percentage of the fair market value that is determined by local assessors to be the total taxable value of land and additions on the property. | Land | Improvement |
|---|---|---|---|---|
| 2024 | $2,437 | $61,560 | $8,000 | $53,560 |
| 2023 | $2,155 | $59,680 | $8,000 | $51,680 |
| 2022 | $2,019 | $50,560 | $8,000 | $42,560 |
| 2021 | $1,664 | $41,240 | $8,000 | $33,240 |
| 2020 | $1,455 | $35,494 | $8,000 | $27,494 |
| 2019 | $1,210 | $28,955 | $6,400 | $22,555 |
| 2018 | $1,159 | $27,686 | $6,400 | $21,286 |
| 2017 | $996 | $23,613 | $6,400 | $17,213 |
| 2016 | $1,046 | $24,841 | $6,400 | $18,441 |
| 2015 | $791 | $0 | $0 | $0 |
| 2014 | $747 | $17,913 | $6,400 | $11,513 |
Source: Public Records
Map
Nearby Homes
- 2731 Lynn Ct
- 6082 Kathie Ct
- 6076 Mount Zion Blvd
- 2820 Rex Rd
- 6050 Randy Ln
- 2835 Randy Ct Unit 4
- 2811 Appaloosa Run
- 2306 Santa fe St Unit 9
- 2278 Santa fe St Unit 18
- 2280 Santa fe St Unit 17
- 6188 Cinnamon Ct
- 2718 Somerton Dr
- 6010 Fieldcrest Dr
- 5838 Highway 42
- 5871 Dan Dr
- 2850 Amerson Trail
- 5631 Laney Dr
- 6205 Fieldcrest Dr
- 5740 Amerson Ln
- 5753 Gum Ct
- 6011 Cristie Dr
- 0 Cristie Dr Unit 7528903
- 0 Cristie Dr Unit 8607343
- 0 Cristie Dr Unit 8127994
- 0 Cristie Dr Unit 8048810
- 0 Cristie Dr Unit 7640335
- 0 Cristie Dr Unit 7332805
- 0 Cristie Dr
- 2736 Lynn Ct
- 2749 Lynn Ct
- 6005 Cristie Dr
- 6020 Cristie Dr
- 6028 Cristie Dr
- 6014 Cristie Dr
- 2730 Lynn Ct
- 6036 Cristie Dr Unit 2
- 2737 Lynn Ct
- 6001 Cristie Dr
- 6010 Cristie Dr
- 6049 Cristie Dr Unit 2