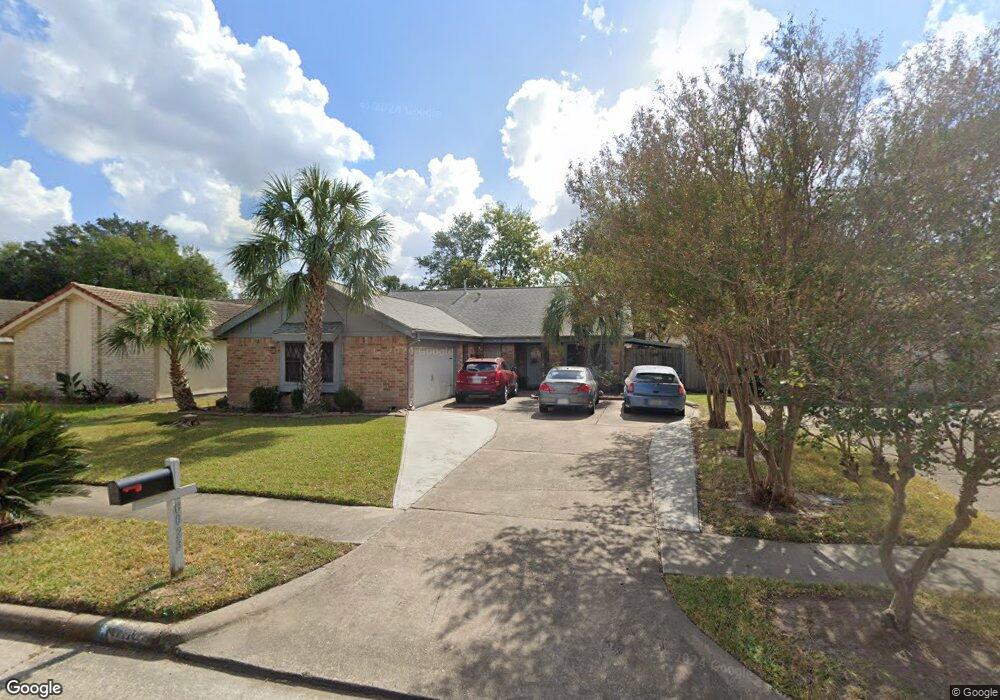
6023 Gallant Forest Dr Houston, TX 77088
Inwood North NeighborhoodEstimated Value: $243,000 - $257,000
3
Beds
2
Baths
1,840
Sq Ft
$134/Sq Ft
Est. Value
About This Home
This home is located at 6023 Gallant Forest Dr, Houston, TX 77088 and is currently estimated at $246,753, approximately $134 per square foot. 6023 Gallant Forest Dr is a home located in Harris County with nearby schools including Nitsch Elementary School, Klein Intermediate School, and Klein Forest High School.
Ownership History
Date
Name
Owned For
Owner Type
Purchase Details
Closed on
Mar 21, 2019
Sold by
Flores Francisco and Flores Santos C
Bought by
Flores Ashley
Current Estimated Value
Home Financials for this Owner
Home Financials are based on the most recent Mortgage that was taken out on this home.
Original Mortgage
$64,500
Outstanding Balance
$49,233
Interest Rate
4.3%
Mortgage Type
Stand Alone First
Estimated Equity
$197,520
Purchase Details
Closed on
Oct 9, 1997
Sold by
Temple Inland Mtg Corp
Bought by
Va
Purchase Details
Closed on
Oct 7, 1997
Sold by
To Martha Cuclan and To Hung Khanh
Bought by
Temple Inland Mtg Corp and Capitol Mtg Bankers Inc
Purchase Details
Closed on
Oct 13, 1993
Sold by
Thornton Vilma J and Thornton Reece Thomas
Bought by
To Hung Khanh and Cuclan Martha
Home Financials for this Owner
Home Financials are based on the most recent Mortgage that was taken out on this home.
Original Mortgage
$67,320
Interest Rate
6.87%
Mortgage Type
Assumption
Create a Home Valuation Report for This Property
The Home Valuation Report is an in-depth analysis detailing your home's value as well as a comparison with similar homes in the area
Home Values in the Area
Average Home Value in this Area
Purchase History
| Date | Buyer | Sale Price | Title Company |
|---|---|---|---|
| Flores Ashley | -- | Vylla Title | |
| Va | -- | -- | |
| Temple Inland Mtg Corp | $54,902 | -- | |
| To Hung Khanh | -- | -- |
Source: Public Records
Mortgage History
| Date | Status | Borrower | Loan Amount |
|---|---|---|---|
| Open | Flores Ashley | $64,500 | |
| Previous Owner | To Hung Khanh | $67,320 |
Source: Public Records
Tax History Compared to Growth
Tax History
| Year | Tax Paid | Tax Assessment Tax Assessment Total Assessment is a certain percentage of the fair market value that is determined by local assessors to be the total taxable value of land and additions on the property. | Land | Improvement |
|---|---|---|---|---|
| 2025 | $2,017 | $225,140 | $59,513 | $165,627 |
| 2024 | $2,017 | $236,943 | $59,513 | $177,430 |
| 2023 | $2,017 | $248,247 | $59,513 | $188,734 |
| 2022 | $2,796 | $225,720 | $39,675 | $186,045 |
| 2021 | $2,680 | $165,040 | $24,797 | $140,243 |
| 2020 | $2,571 | $152,392 | $24,797 | $127,595 |
| 2019 | $2,408 | $85,000 | $15,870 | $69,130 |
| 2018 | $858 | $85,000 | $15,870 | $69,130 |
| 2017 | $2,409 | $110,534 | $15,870 | $94,664 |
| 2016 | $2,697 | $110,534 | $15,870 | $94,664 |
| 2015 | $1,903 | $102,371 | $15,870 | $86,501 |
| 2014 | $1,903 | $79,248 | $15,870 | $63,378 |
Source: Public Records
Map
Nearby Homes
- 6023 Elkwood Forest Dr
- 6114 Elkwood Forest Dr
- 6122 Gallant Forest Dr
- 5935 Caruso Forest Dr
- 5942 Caruso Forest Dr
- 6006 Ogden Forest Dr
- 32 Regency Ln
- 8726 Wildforest Dr
- 6011 Green Falls Dr
- 5831 Longforest Dr
- 8810 Enchanted Forest Dr
- 5622 Bridge Forest Dr
- 6630 Inwood Dr W
- 6703 Casablanca Dr
- 5718 Longforest Dr
- 6222 Downwood Forest Dr
- 5638 Hickory Forest Dr
- 7868 Green Lawn Dr Unit 7868
- 5507 Greenhill Forest Dr
- 9614 Summer Laurel Ln
- 6027 Gallant Forest Dr
- 6019 Gallant Forest Dr
- 6031 Gallant Forest Dr
- 6015 Gallant Forest Dr
- 6102 Elkwood Forest Dr
- 6030 Elkwood Forest Dr
- 6106 Elkwood Forest Dr
- 6026 Elkwood Forest Dr
- 6035 Gallant Forest Dr
- 6011 Gallant Forest Dr
- 6022 Gallant Forest Dr
- 6026 Gallant Forest Dr
- 6018 Gallant Forest Dr
- 6030 Gallant Forest Dr
- 6110 Elkwood Forest Dr
- 6022 Elkwood Forest Dr
- 6014 Gallant Forest Dr
- 6103 Gallant Forest Dr
- 6034 Gallant Forest Dr
- 6007 Gallant Forest Dr