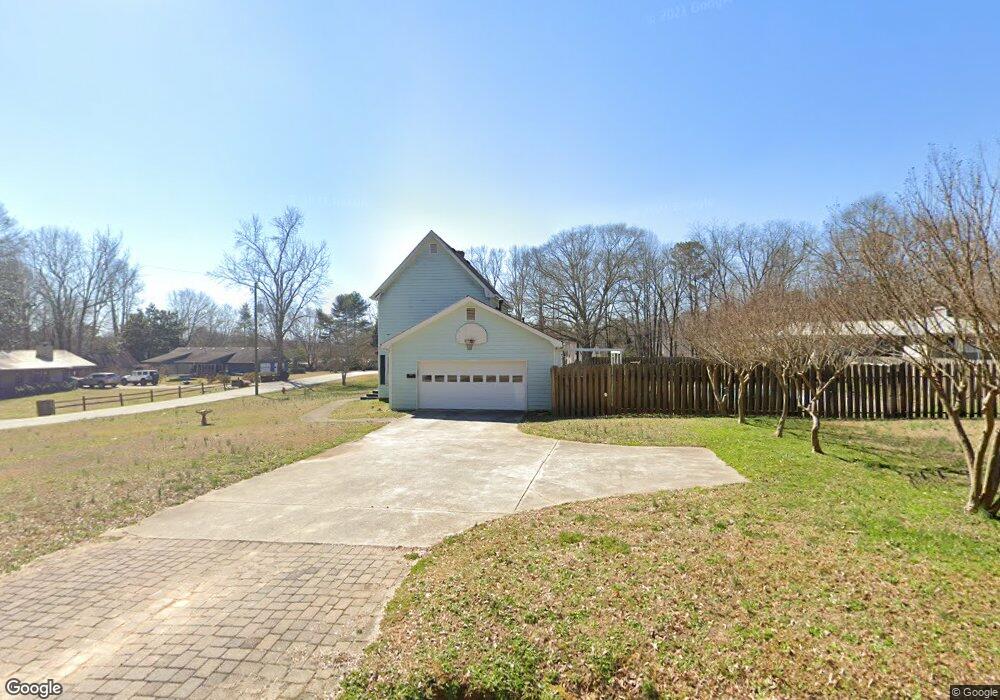
6023 Morrow Dr Flowery Branch, GA 30542
Estimated Value: $288,312 - $347,000
3
Beds
2
Baths
1,591
Sq Ft
$199/Sq Ft
Est. Value
About This Home
This home is located at 6023 Morrow Dr, Flowery Branch, GA 30542 and is currently estimated at $317,078, approximately $199 per square foot. 6023 Morrow Dr is a home located in Hall County with nearby schools including Flowery Branch Elementary School, West Hall Middle School, and West Hall High School.
Ownership History
Date
Name
Owned For
Owner Type
Purchase Details
Closed on
Jan 28, 2022
Sold by
Goss Christa Carter
Bought by
Goss Aleah Ruth
Current Estimated Value
Home Financials for this Owner
Home Financials are based on the most recent Mortgage that was taken out on this home.
Original Mortgage
$79,860
Outstanding Balance
$74,165
Interest Rate
3.56%
Mortgage Type
Cash
Estimated Equity
$242,913
Purchase Details
Closed on
Sep 30, 2021
Sold by
Tullis William Cain
Bought by
Goss Christa Carter
Purchase Details
Closed on
Aug 17, 2021
Sold by
Tallent Tommy Edgar
Bought by
Tullis William Cain
Purchase Details
Closed on
Dec 23, 2015
Sold by
Tallent Pamela Karen Green
Bought by
Tullis William Cain
Purchase Details
Closed on
Jan 2, 2015
Sold by
Green David
Bought by
Green Vivian Garrett and Green David
Purchase Details
Closed on
Sep 28, 2001
Sold by
Green Pamela Karen
Bought by
Tallent Pamela Karen
Create a Home Valuation Report for This Property
The Home Valuation Report is an in-depth analysis detailing your home's value as well as a comparison with similar homes in the area
Home Values in the Area
Average Home Value in this Area
Purchase History
| Date | Buyer | Sale Price | Title Company |
|---|---|---|---|
| Goss Aleah Ruth | $224,860 | -- | |
| Goss Christa Carter | $190,000 | -- | |
| Tullis William Cain | -- | -- | |
| Tullis William Cain | $144,577 | -- | |
| Green Vivian Garrett | -- | -- | |
| Tallent Pamela Karen | -- | -- |
Source: Public Records
Mortgage History
| Date | Status | Borrower | Loan Amount |
|---|---|---|---|
| Open | Goss Aleah Ruth | $79,860 |
Source: Public Records
Tax History Compared to Growth
Tax History
| Year | Tax Paid | Tax Assessment Tax Assessment Total Assessment is a certain percentage of the fair market value that is determined by local assessors to be the total taxable value of land and additions on the property. | Land | Improvement |
|---|---|---|---|---|
| 2024 | $2,213 | $78,040 | $12,400 | $65,640 |
| 2023 | $1,976 | $78,760 | $12,400 | $66,360 |
| 2022 | $1,688 | $64,560 | $6,000 | $58,560 |
| 2021 | $1,644 | $61,720 | $6,000 | $55,720 |
| 2020 | $1,409 | $51,400 | $2,680 | $48,720 |
| 2019 | $1,248 | $45,120 | $2,680 | $42,440 |
| 2018 | $1,102 | $38,560 | $2,680 | $35,880 |
| 2017 | $1,039 | $35,480 | $2,680 | $32,800 |
| 2016 | $980 | $34,280 | $4,400 | $29,880 |
| 2015 | $1,148 | $41,831 | $4,000 | $37,831 |
| 2014 | $1,148 | $41,831 | $4,000 | $37,831 |
Source: Public Records
Map
Nearby Homes
- 5583 Spring St
- 5587 Spring St
- 5579 Spring St
- 5761 Screech Owl Dr
- The Spring Hollow Plan at Rose Harbor
- The Danville Plan at Rose Harbor
- The Spring Hill Plan at Rose Harbor
- The Richmond Plan at Rose Harbor
- 5566 Spring St
- 5550 Spring St
- The Miller Plan at Hemingway
- The Filmore Plan at Hemingway
- The Birch Plan at Hemingway
- The Everglade Plan at Hemingway
- The Creekwood Plan at Hemingway
- The Maddox Plan at Hemingway
- The Madison Plan at Hemingway
- 5751 Turnstone Trail
- 6421 Kettle Creek Way
- 5967 Screech Owl Dr
- 6025 Morrow Dr
- 6005 Morrow Dr
- 6010 Lights Ferry Rd
- 6022 Morrow Dr
- 6018 Morrow Dr
- 6033 Morrow Dr
- 6028 Morrow Dr
- 6008 Morrow Dr
- 6016 Morrow Dr
- 6014 Morrow Dr
- 5996 Lights Ferry Rd
- 6030 Morrow Dr
- 6020 Morrow Dr
- 6037 Morrow Dr
- 6034 Morrow Dr
- 5990 Lights Ferry Rd
- 7031 Valley Forge Dr
- 6022 Lights Ferry Rd
- 7027 Valley Forge Dr
- 6026 Lights Ferry Rd