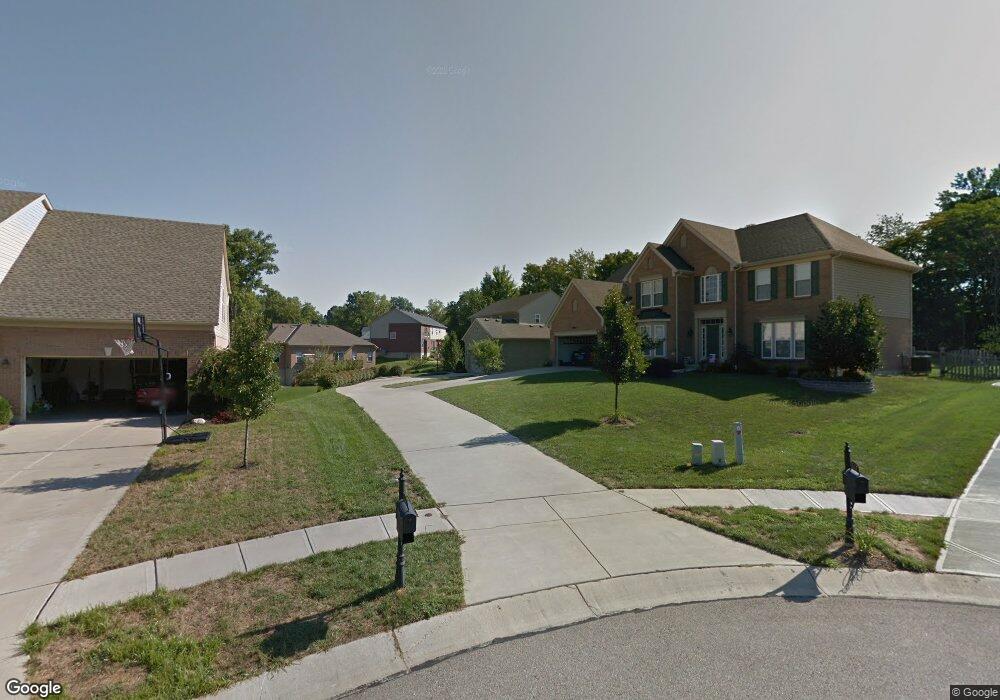
6024 Pond View Ct Cincinnati, OH 45247
Estimated Value: $450,543 - $483,000
4
Beds
3
Baths
2,122
Sq Ft
$218/Sq Ft
Est. Value
About This Home
This home is located at 6024 Pond View Ct, Cincinnati, OH 45247 and is currently estimated at $462,136, approximately $217 per square foot. 6024 Pond View Ct is a home located in Hamilton County with nearby schools including Monfort Heights Elementary School, White Oak Middle School, and Colerain High School.
Ownership History
Date
Name
Owned For
Owner Type
Purchase Details
Closed on
Jul 6, 2005
Sold by
Meyer Builders Douglas Homes Ltd
Bought by
Arter Eric M and Arter Melissa K
Current Estimated Value
Home Financials for this Owner
Home Financials are based on the most recent Mortgage that was taken out on this home.
Original Mortgage
$228,700
Outstanding Balance
$116,482
Interest Rate
5.68%
Mortgage Type
Unknown
Estimated Equity
$345,654
Purchase Details
Closed on
Mar 25, 2005
Sold by
Brierly Ridge Estates Llc
Bought by
Meyer Builders Douglas Homes Ltd
Home Financials for this Owner
Home Financials are based on the most recent Mortgage that was taken out on this home.
Original Mortgage
$16,000,000
Outstanding Balance
$8,002,145
Interest Rate
5.71%
Mortgage Type
Unknown
Estimated Equity
-$7,540,009
Create a Home Valuation Report for This Property
The Home Valuation Report is an in-depth analysis detailing your home's value as well as a comparison with similar homes in the area
Home Values in the Area
Average Home Value in this Area
Purchase History
| Date | Buyer | Sale Price | Title Company |
|---|---|---|---|
| Arter Eric M | $305,000 | Advanced Land Title Agency | |
| Meyer Builders Douglas Homes Ltd | $71,000 | First Title Agency Inc |
Source: Public Records
Mortgage History
| Date | Status | Borrower | Loan Amount |
|---|---|---|---|
| Open | Arter Eric M | $228,700 | |
| Open | Meyer Builders Douglas Homes Ltd | $16,000,000 |
Source: Public Records
Tax History
| Year | Tax Paid | Tax Assessment Tax Assessment Total Assessment is a certain percentage of the fair market value that is determined by local assessors to be the total taxable value of land and additions on the property. | Land | Improvement |
|---|---|---|---|---|
| 2025 | $7,138 | $131,754 | $16,800 | $114,954 |
| 2023 | $7,013 | $131,754 | $16,800 | $114,954 |
| 2022 | $6,488 | $99,565 | $17,640 | $81,925 |
| 2021 | $5,947 | $99,565 | $17,640 | $81,925 |
| 2020 | $6,006 | $99,565 | $17,640 | $81,925 |
| 2019 | $6,313 | $94,822 | $16,800 | $78,022 |
| 2018 | $5,621 | $94,822 | $16,800 | $78,022 |
| 2017 | $5,312 | $94,822 | $16,800 | $78,022 |
| 2016 | $5,729 | $100,766 | $24,602 | $76,164 |
| 2015 | $5,782 | $100,766 | $24,602 | $76,164 |
| 2014 | $5,792 | $100,766 | $24,602 | $76,164 |
| 2013 | $5,471 | $101,784 | $24,850 | $76,934 |
Source: Public Records
Map
Nearby Homes
- Site 1 Brierly Creek Rd
- 6051 Shelrich Ct
- 5991 Gaines Rd
- 6670 Gaines Rd
- 5876 Sutters Mill Dr
- 5804 Cedaridge Dr
- 5563 Haft Rd
- 5547 Hubble Rd
- 5588 W Fork Rd
- 5442 Bluesky Dr
- 5705 Blackwolf Run
- 6384 Conifer Ln
- 5080 Jessup Rd
- 5221 Clearlake Dr
- 6707 Weiss Rd
- 5339 Race Rd
- 5182 Michael Anthony Ln
- 5207 S Eaglesnest Dr
- 4643 Whispering Oak Trail
- 6150 Wilmer Rd
- 6020 Pond View Ct
- 5994 Brierly Ridge Dr
- 6028 Pond View Ct
- 6010 Pond View Ct
- 35 Pond View Ct
- 6040 Peachview Dr
- 5990 Brierly Ridge Dr
- 6036 Pond View Ct
- 5999 Brierly Ridge Dr
- 5986 Brierly Ridge Dr
- 6019 Pond View Ct
- 6023 Pond View Ct
- 6029 Pond View Ct
- 6042 Peachview Dr
- 5993 Brierly Ridge Dr
- 5989 Brierly Ridge Dr
- 6035 Pond View Ct
- 5997 Brierly Ridge Dr
- 5985 Brierly Ridge Dr
- 6051 Pond View Ct
Your Personal Tour Guide
Ask me questions while you tour the home.