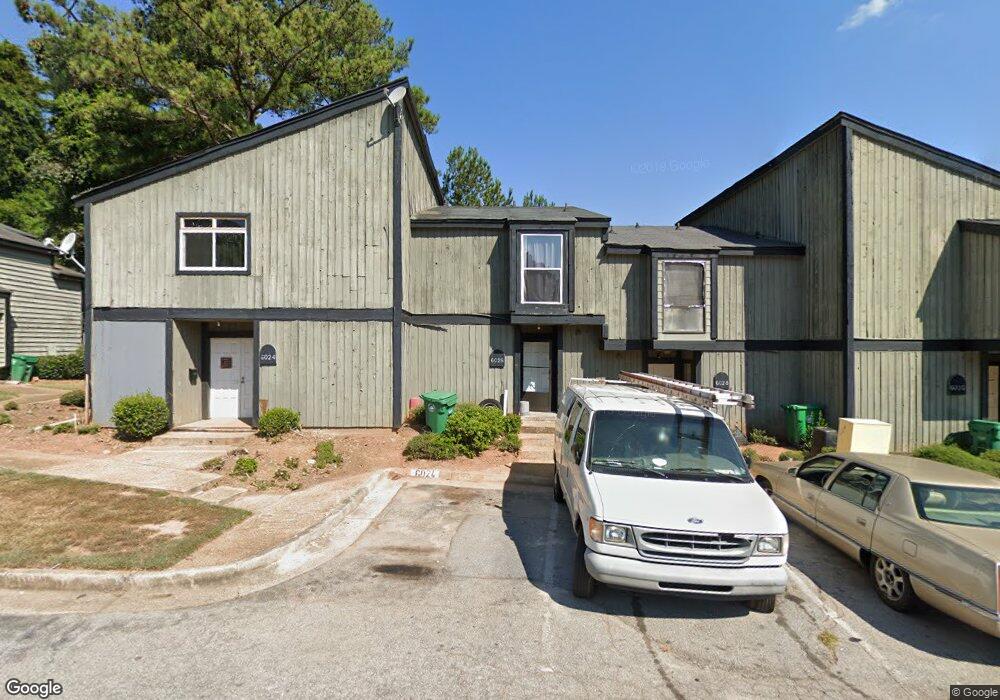
6026 Regent Manor Unit 6026 Lithonia, GA 30058
Estimated Value: $67,000 - $79,000
3
Beds
2
Baths
1,222
Sq Ft
$58/Sq Ft
Est. Value
About This Home
This home is located at 6026 Regent Manor Unit 6026, Lithonia, GA 30058 and is currently estimated at $70,468, approximately $57 per square foot. 6026 Regent Manor Unit 6026 is a home located in DeKalb County with nearby schools including Stoneview Elementary School, Lithonia Middle School, and Lithonia High School.
Ownership History
Date
Name
Owned For
Owner Type
Purchase Details
Closed on
Aug 23, 2024
Sold by
Mcqueen Legacy Trust
Bought by
Durham Dana Pulliam
Current Estimated Value
Purchase Details
Closed on
Mar 30, 2005
Sold by
Wells Farg Bk Minn Na
Bought by
Charles Kenneth
Home Financials for this Owner
Home Financials are based on the most recent Mortgage that was taken out on this home.
Original Mortgage
$22,000
Interest Rate
5.79%
Purchase Details
Closed on
Aug 3, 2004
Sold by
Salomon Bros Mtg Securs Vii In
Bought by
Salomon Bros Mtg Securs Vii In
Purchase Details
Closed on
Jul 18, 1997
Sold by
Vantreese Jean
Bought by
Pyron Devika
Home Financials for this Owner
Home Financials are based on the most recent Mortgage that was taken out on this home.
Original Mortgage
$28,425
Interest Rate
10.25%
Mortgage Type
New Conventional
Create a Home Valuation Report for This Property
The Home Valuation Report is an in-depth analysis detailing your home's value as well as a comparison with similar homes in the area
Home Values in the Area
Average Home Value in this Area
Purchase History
| Date | Buyer | Sale Price | Title Company |
|---|---|---|---|
| Durham Dana Pulliam | $82,000 | -- | |
| Charles Kenneth | $22,000 | -- | |
| Salomon Bros Mtg Securs Vii In | $24,030 | -- | |
| Pyron Devika | $37,900 | -- |
Source: Public Records
Mortgage History
| Date | Status | Borrower | Loan Amount |
|---|---|---|---|
| Previous Owner | Charles Kenneth | $22,000 | |
| Previous Owner | Pyron Devika | $28,425 |
Source: Public Records
Tax History Compared to Growth
Tax History
| Year | Tax Paid | Tax Assessment Tax Assessment Total Assessment is a certain percentage of the fair market value that is determined by local assessors to be the total taxable value of land and additions on the property. | Land | Improvement |
|---|---|---|---|---|
| 2025 | $1,609 | $27,680 | $3,200 | $24,480 |
| 2024 | $1,784 | $31,880 | $3,200 | $28,680 |
| 2023 | $1,784 | $19,640 | $3,200 | $16,440 |
| 2022 | $1,085 | $18,120 | $3,200 | $14,920 |
| 2021 | $950 | $14,800 | $3,200 | $11,600 |
| 2020 | $816 | $11,920 | $3,200 | $8,720 |
| 2019 | $721 | $9,840 | $3,200 | $6,640 |
| 2018 | $625 | $10,120 | $1,600 | $8,520 |
| 2017 | $718 | $9,720 | $1,600 | $8,120 |
| 2016 | $720 | $9,760 | $840 | $8,920 |
| 2014 | $519 | $5,080 | $840 | $4,240 |
Source: Public Records
Map
Nearby Homes
- 5914 Sutcliff Square
- 5918 Sutcliff Square
- 5925 Sutcliff Square
- 2722 Penwood Place
- 2539 Willow Way Dr
- 2863 Hillvale Cove Dr
- 2396 Hillvale Cir
- 5867 Heritage Walk
- 112 Hillandale Ct
- 3127 Fields Dr
- 6900 Covington Hwy
- 167 Tiburon Dr
- 2936 Parc Lorraine
- 2161 Wellington Cir Unit 2161
- 2968
- 5806 Keystone Grove
- 2900 Parc Lorraine
- 2173 Wellington Cir
- 2914 Parc Lorraine
- 2680 Stonekey Bend
- 6024 Regent Manor
- 6028 Regent Manor
- 6030 Regent Manor
- 6022 Regent Manor
- 6032 Regent Manor Unit 6032
- 6020 Regent Manor
- 6034 Regent Manor
- 6023 Regent Manor
- 6018 Regent Manor
- 6021 Regent Manor
- 6036 Regent Manor
- 2699 Hillvale Cove Dr Unit 2
- 2694 Hillvale Cove Dr Unit 2
- 6016 Regent Manor
- 6019 Regent Manor
- 6019 Regent Manor
- 6031 Regent Manor
- 6017 Regent Manor Unit 6017
- 6015 Regent Manor
- 6014 Regent Manor