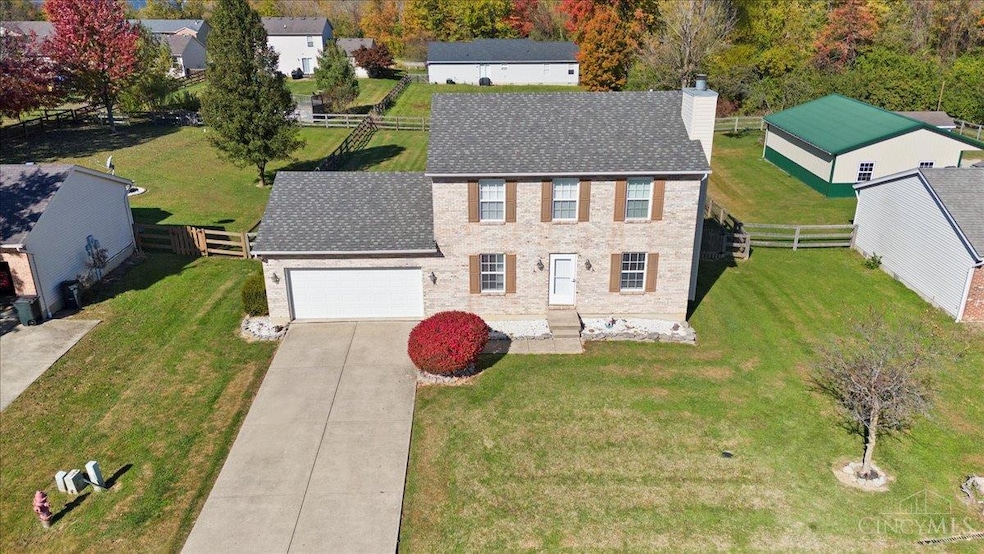
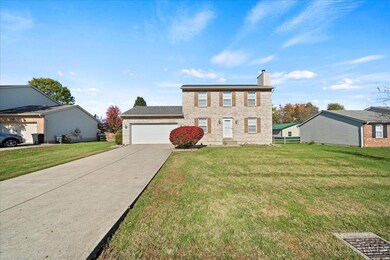
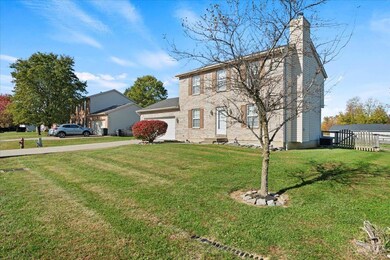
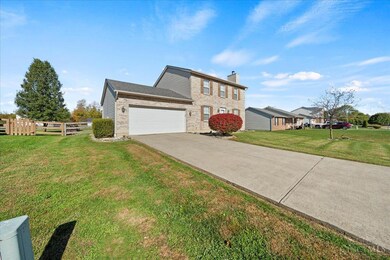
6027 Sean Cir Blanchester, OH 45107
Estimated payment $1,836/month
Highlights
- Traditional Architecture
- Solid Surface Countertops
- 2 Car Attached Garage
- Cross Plains High School Rated A-
- No HOA
- Eat-In Kitchen
About This Home
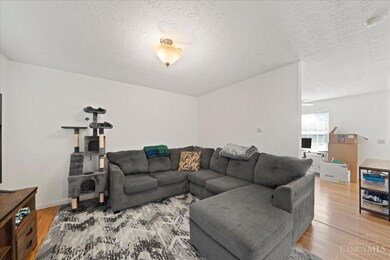
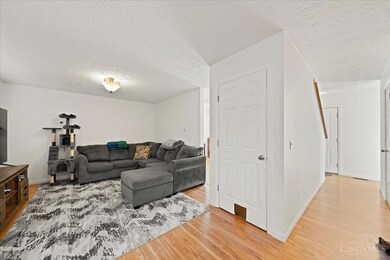
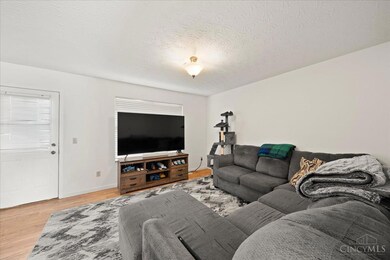
Welcome to 6027 Sean Circle! A move-in ready 4-bed, 2.5-bath brick two-story tucked on a quiet cul-de-sac in Blanchester's Creek Side Estates. You'll feel the space right away with nearly 1,500 SF of comfortable living and an open main level made for connection. The kitchen seamlessly flows into the dining & living areas, allowing you to cook, gather, & keep everyone close. Upstairs, the primary suite offers privacy, two closets, & a full bath, while three more bedrooms give options for family, guests, or a home office. Step outside to a large, fenced backyard that's perfect for kids, pets, or weekend grilling. The lot is a generous third of an acre with room to breathe, yet easy to maintain. Two-car garage, Recent updates to all the major mechanicals & roof. A peaceful street minutes from schools and local amenities. This home strikes the perfect balance; affordable, functional, & full of potential. Schedule your showing and come see why homes on Sean Circle don't last! USDA eligible!
Home Details
Home Type
- Single Family
Est. Annual Taxes
- $3,150
Year Built
- Built in 2002
Lot Details
- 0.34 Acre Lot
- Wood Fence
Parking
- 2 Car Attached Garage
- Front Facing Garage
- Garage Door Opener
- Driveway
- On-Street Parking
Home Design
- Traditional Architecture
- Brick Exterior Construction
- Poured Concrete
- Shingle Roof
- Vinyl Siding
Interior Spaces
- 1,500 Sq Ft Home
- 2-Story Property
- Electric Fireplace
- Vinyl Clad Windows
- Storage In Attic
- Fire and Smoke Detector
Kitchen
- Eat-In Kitchen
- Oven or Range
- Microwave
- Dishwasher
- Solid Surface Countertops
- Solid Wood Cabinet
Flooring
- Laminate
- Concrete
Bedrooms and Bathrooms
- 4 Bedrooms
- Dual Vanity Sinks in Primary Bathroom
- Bathtub
Unfinished Basement
- Basement Fills Entire Space Under The House
- Sump Pump with Backup
Outdoor Features
- Patio
Utilities
- Forced Air Heating and Cooling System
- 220 Volts
- Natural Gas Not Available
- Electric Water Heater
- Cable TV Available
Community Details
- No Home Owners Association
- Creek Side Estates Subdivision
Map
Home Values in the Area
Average Home Value in this Area
Tax History
| Year | Tax Paid | Tax Assessment Tax Assessment Total Assessment is a certain percentage of the fair market value that is determined by local assessors to be the total taxable value of land and additions on the property. | Land | Improvement |
|---|---|---|---|---|
| 2024 | $3,151 | $84,210 | $4,760 | $79,450 |
| 2023 | $3,151 | $84,210 | $4,760 | $79,450 |
| 2022 | $2,909 | $70,380 | $3,230 | $67,150 |
| 2021 | $3,048 | $70,380 | $3,230 | $67,150 |
| 2020 | $3,039 | $70,380 | $3,230 | $67,150 |
| 2019 | $2,073 | $46,540 | $3,500 | $43,040 |
| 2018 | $2,082 | $46,540 | $3,500 | $43,040 |
| 2017 | $2,038 | $46,540 | $3,500 | $43,040 |
| 2016 | $1,654 | $39,590 | $5,460 | $34,130 |
| 2015 | $1,654 | $39,590 | $5,460 | $34,130 |
| 2013 | $1,705 | $39,590 | $5,460 | $34,130 |
Property History
| Date | Event | Price | List to Sale | Price per Sq Ft |
|---|---|---|---|---|
| 11/01/2025 11/01/25 | Pending | -- | -- | -- |
| 10/28/2025 10/28/25 | For Sale | $299,900 | -- | $200 / Sq Ft |
Purchase History
| Date | Type | Sale Price | Title Company |
|---|---|---|---|
| Quit Claim Deed | -- | -- | |
| Warranty Deed | -- | None Available | |
| Corporate Deed | $138,000 | Priority Land Title Agency |
Mortgage History
| Date | Status | Loan Amount | Loan Type |
|---|---|---|---|
| Open | $122,500 | No Value Available | |
| Previous Owner | $147,500 | Fannie Mae Freddie Mac | |
| Previous Owner | $131,100 | Purchase Money Mortgage |
Source: MLS of Greater Cincinnati (CincyMLS)
MLS Number: 1860023
APN: 220-09-05-01-0020-00
Disclaimer: Certain information contained herein is derived from information provided by parties other than Homes.com. All information provided is deemed reliable, but is not guaranteed to be accurate and should be independently verified.
![]() The data relating to real estate for sale on this website comes in part from the Broker Reciprocity programs of the MLS of Greater Cincinnati, Inc.. Those listings held by brokerage firms other than Ten-X are marked with the Broker Reciprocity logo and house icon. The properties displayed may not be all of the properties available through Broker Reciprocity.
The data relating to real estate for sale on this website comes in part from the Broker Reciprocity programs of the MLS of Greater Cincinnati, Inc.. Those listings held by brokerage firms other than Ten-X are marked with the Broker Reciprocity logo and house icon. The properties displayed may not be all of the properties available through Broker Reciprocity.
IDX information is provided exclusively for personal, non-commercial use, and may not be used for any purpose other than to identify prospective properties consumers may be interested in purchasing.
Information is deemed reliable but not guaranteed.
Ten-X does not display the entire Cincinnati MLS Broker Reciprocity™ database on this web site. The listings of some real estate brokerage firms have been excluded.
Copyright 2025, MLS of Greater Cincinnati, Inc. All rights reserved
- 5000 Sean Cir
- 5010 Sean Cir
- 5003 Sean Cir
- 5001 Sean Cir
- 5002 Sean Cir
- 5458 Oak Grove Ave
- 7504 Brock Dr
- 7478 Fairground Rd
- 7484 Fairground Rd
- B Cherry St
- D Cherry St
- 510 Cherry St
- 508 Cherry St
- 506 Cherry St
- 1432 State Route 28
- 221 S Vine St
- 0 Ohio 123 Unit 11 938995
- 0 Ohio 123 Unit 1848086
- 503 S Broadway St
- 504 Cherry St
