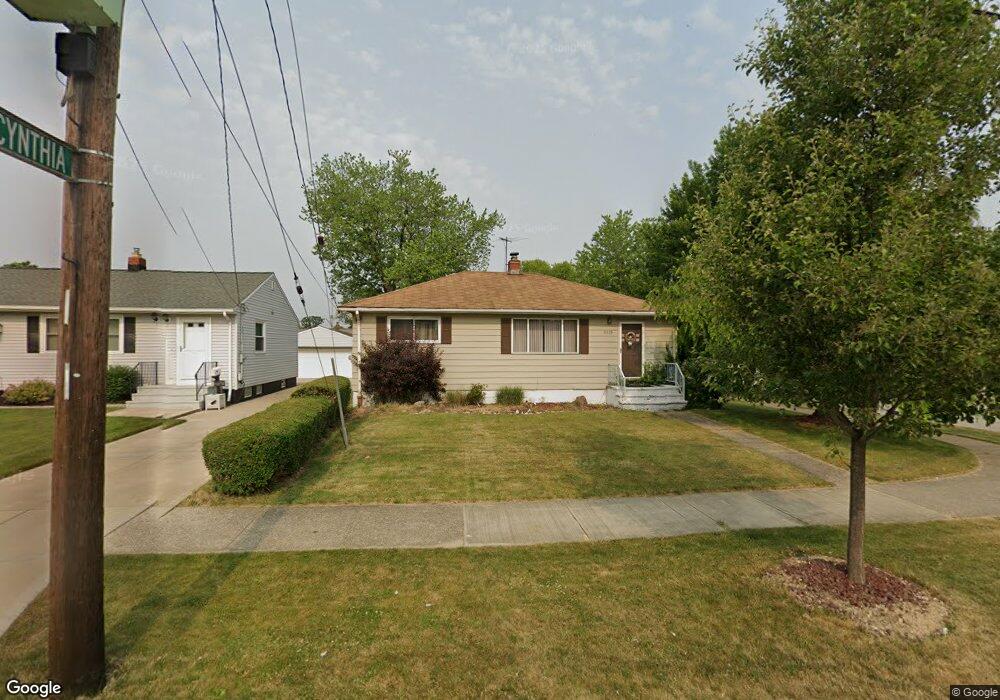
6028 Fry Rd Brookpark, OH 44142
Estimated Value: $193,667 - $220,000
3
Beds
1
Bath
936
Sq Ft
$225/Sq Ft
Est. Value
About This Home
This home is located at 6028 Fry Rd, Brookpark, OH 44142 and is currently estimated at $210,417, approximately $224 per square foot. 6028 Fry Rd is a home located in Cuyahoga County with nearby schools including Berea-Midpark Middle School, Berea-Midpark High School, and Huber Heights Preparatory Academy Parma Academy.
Ownership History
Date
Name
Owned For
Owner Type
Purchase Details
Closed on
Oct 17, 2000
Sold by
Fondale Oranell V
Bought by
Holland Edward J and Holland Pamela
Current Estimated Value
Home Financials for this Owner
Home Financials are based on the most recent Mortgage that was taken out on this home.
Original Mortgage
$113,349
Outstanding Balance
$41,455
Interest Rate
7.96%
Mortgage Type
FHA
Estimated Equity
$168,962
Purchase Details
Closed on
May 20, 1987
Sold by
Miker John M and Miker Diane L
Bought by
Fondale Oranell
Purchase Details
Closed on
Jan 26, 1984
Sold by
Miker John M
Bought by
Miker John M and Miker Diane L
Purchase Details
Closed on
Aug 17, 1976
Sold by
Edmison Lee E and Edmison Rosemary
Bought by
Miker John M
Purchase Details
Closed on
Jan 1, 1975
Bought by
Edmison Lee E and Edmison Rosemary
Create a Home Valuation Report for This Property
The Home Valuation Report is an in-depth analysis detailing your home's value as well as a comparison with similar homes in the area
Home Values in the Area
Average Home Value in this Area
Purchase History
| Date | Buyer | Sale Price | Title Company |
|---|---|---|---|
| Holland Edward J | $114,000 | Ohio Title Corporation | |
| Fondale Oranell | $62,000 | -- | |
| Miker John M | -- | -- | |
| Miker John M | $40,500 | -- | |
| Edmison Lee E | -- | -- |
Source: Public Records
Mortgage History
| Date | Status | Borrower | Loan Amount |
|---|---|---|---|
| Open | Holland Edward J | $113,349 |
Source: Public Records
Tax History Compared to Growth
Tax History
| Year | Tax Paid | Tax Assessment Tax Assessment Total Assessment is a certain percentage of the fair market value that is determined by local assessors to be the total taxable value of land and additions on the property. | Land | Improvement |
|---|---|---|---|---|
| 2024 | $2,630 | $52,150 | $11,270 | $40,880 |
| 2023 | $2,676 | $43,930 | $9,140 | $34,790 |
| 2022 | $2,657 | $43,930 | $9,140 | $34,790 |
| 2021 | $2,641 | $43,930 | $9,140 | $34,790 |
| 2020 | $2,382 | $34,860 | $7,250 | $27,620 |
| 2019 | $2,311 | $99,600 | $20,700 | $78,900 |
| 2018 | $2,202 | $34,860 | $7,250 | $27,620 |
| 2017 | $2,276 | $31,860 | $7,110 | $24,750 |
| 2016 | $2,258 | $31,860 | $7,110 | $24,750 |
| 2015 | $2,230 | $31,860 | $7,110 | $24,750 |
| 2014 | $2,230 | $33,530 | $7,490 | $26,040 |
Source: Public Records
Map
Nearby Homes
- 6054 Langer Dr
- 16051 Holland Rd
- 15924 Richard Dr
- 5966 Engle Rd
- 17810 Engle Ct
- 6363 Lockhaven Dr
- 6378 Edgehurst Dr
- 6195 Hardin Dr
- 6470 Sandfield Dr
- 14890 Holland Rd
- 6537 Liberty Bell Dr Unit 160
- 16193 Emerald Point Unit 16193
- 6577 Liberty Bell Dr Unit 20C
- 15446 Sheldon Rd
- 6401 Scott Dr
- 6109 Westbrook Dr
- 14417 Parkman Blvd
- 6728 Benedict Dr
- 6740 Benedict Dr
- 6755 Benedict Dr