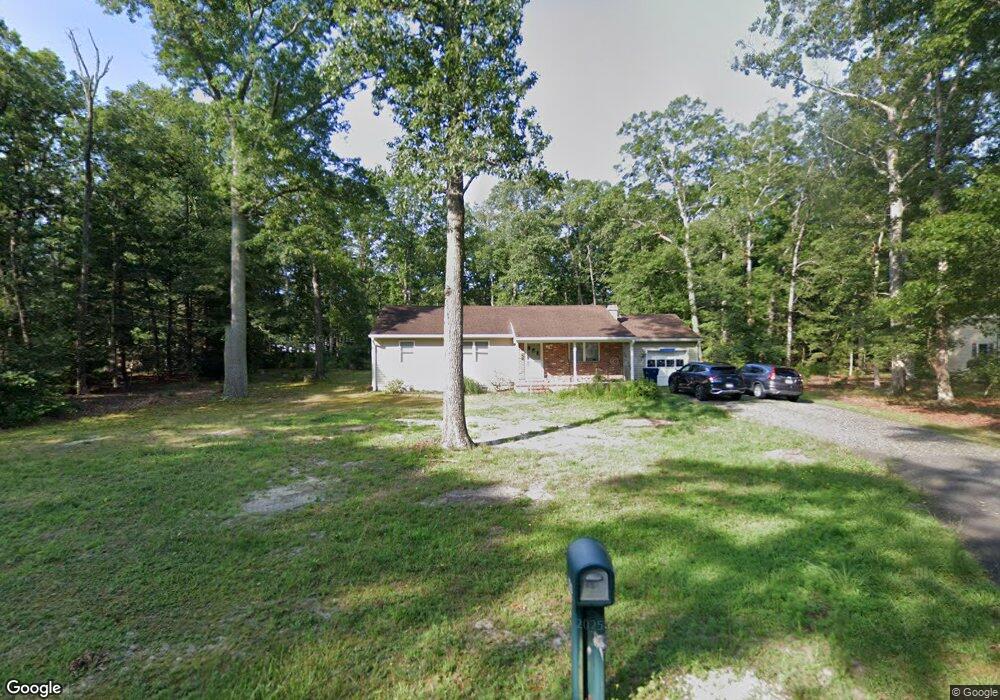
6028 Hickory St Mays Landing, NJ 08330
Estimated Value: $238,000 - $302,246
--
Bed
--
Bath
1,242
Sq Ft
$212/Sq Ft
Est. Value
About This Home
This home is located at 6028 Hickory St, Mays Landing, NJ 08330 and is currently estimated at $262,749, approximately $211 per square foot. 6028 Hickory St is a home located in Atlantic County with nearby schools including Joseph Shaner School, George L. Hess Educational Complex, and William Davies Middle School.
Ownership History
Date
Name
Owned For
Owner Type
Purchase Details
Closed on
Apr 15, 2025
Sold by
Daly Patricia C
Bought by
Desantis Joseph
Current Estimated Value
Home Financials for this Owner
Home Financials are based on the most recent Mortgage that was taken out on this home.
Original Mortgage
$100,000
Interest Rate
6.81%
Mortgage Type
New Conventional
Purchase Details
Closed on
Mar 31, 1986
Bought by
Daly Lawrence E and Daly Patricia C
Create a Home Valuation Report for This Property
The Home Valuation Report is an in-depth analysis detailing your home's value as well as a comparison with similar homes in the area
Home Values in the Area
Average Home Value in this Area
Purchase History
| Date | Buyer | Sale Price | Title Company |
|---|---|---|---|
| Desantis Joseph | $250,000 | National Integrity | |
| Daly Lawrence E | $63,000 | -- |
Source: Public Records
Mortgage History
| Date | Status | Borrower | Loan Amount |
|---|---|---|---|
| Previous Owner | Desantis Joseph | $100,000 |
Source: Public Records
Tax History Compared to Growth
Tax History
| Year | Tax Paid | Tax Assessment Tax Assessment Total Assessment is a certain percentage of the fair market value that is determined by local assessors to be the total taxable value of land and additions on the property. | Land | Improvement |
|---|---|---|---|---|
| 2025 | $5,136 | $149,700 | $39,600 | $110,100 |
| 2024 | $5,136 | $149,700 | $39,600 | $110,100 |
| 2023 | $4,829 | $149,700 | $39,600 | $110,100 |
| 2022 | $4,829 | $149,700 | $39,600 | $110,100 |
| 2021 | $4,819 | $149,700 | $39,600 | $110,100 |
| 2020 | $4,819 | $149,700 | $39,600 | $110,100 |
| 2019 | $4,831 | $149,700 | $39,600 | $110,100 |
| 2018 | $4,662 | $149,700 | $39,600 | $110,100 |
| 2017 | $4,588 | $149,700 | $39,600 | $110,100 |
| 2016 | $4,460 | $149,700 | $39,600 | $110,100 |
| 2015 | $4,308 | $149,700 | $39,600 | $110,100 |
| 2014 | $4,256 | $162,000 | $44,600 | $117,400 |
Source: Public Records
Map
Nearby Homes