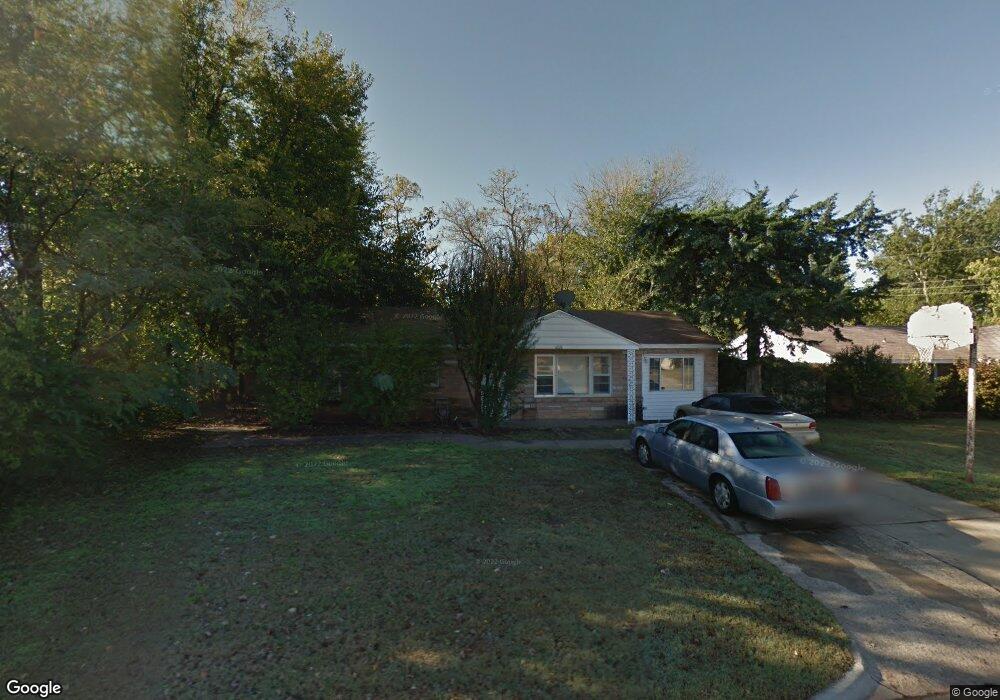
6028 NW 59th St Oklahoma City, OK 73122
Estimated Value: $109,000 - $133,161
3
Beds
1
Bath
936
Sq Ft
$135/Sq Ft
Est. Value
About This Home
This home is located at 6028 NW 59th St, Oklahoma City, OK 73122 and is currently estimated at $126,540, approximately $135 per square foot. 6028 NW 59th St is a home located in Oklahoma County with nearby schools including Central Elementary School, James L. Capps Middle School, and Putnam City High School.
Ownership History
Date
Name
Owned For
Owner Type
Purchase Details
Closed on
Sep 29, 2022
Sold by
Hulson Revocable Trust
Bought by
Tbh Family Trust
Current Estimated Value
Purchase Details
Closed on
Jun 19, 2012
Sold by
Secretary Of Hud Of Washington Dc
Bought by
Mcguffin & Mcguffin Inc
Purchase Details
Closed on
Oct 11, 2011
Sold by
Sharp Virginia M and Citimortgage Inc
Bought by
Sevretary Of Housing & Urban Development
Purchase Details
Closed on
Jan 8, 2009
Sold by
Durbin Charlye and Durbin Velda Charlene
Bought by
Sharp Virginia M
Home Financials for this Owner
Home Financials are based on the most recent Mortgage that was taken out on this home.
Original Mortgage
$77,077
Interest Rate
5.99%
Mortgage Type
FHA
Purchase Details
Closed on
Oct 22, 2004
Sold by
Durbin Charlye
Bought by
Durbin Charlye V
Purchase Details
Closed on
Oct 1, 2004
Sold by
Ledbetter Donna and Simpson Bronson
Bought by
Durbin Charlye
Create a Home Valuation Report for This Property
The Home Valuation Report is an in-depth analysis detailing your home's value as well as a comparison with similar homes in the area
Home Values in the Area
Average Home Value in this Area
Purchase History
| Date | Buyer | Sale Price | Title Company |
|---|---|---|---|
| Tbh Family Trust | -- | -- | |
| Mcguffin & Mcguffin Inc | -- | Heartland Title And Closing | |
| Sevretary Of Housing & Urban Development | -- | Oklahoma City Abstract & Tit | |
| Sharp Virginia M | $78,500 | Stewart Abstract & Title Of | |
| Durbin Charlye V | -- | First American Title & Tr Co | |
| Durbin Charlye | $55,000 | -- |
Source: Public Records
Mortgage History
| Date | Status | Borrower | Loan Amount |
|---|---|---|---|
| Previous Owner | Sharp Virginia M | $77,077 |
Source: Public Records
Tax History Compared to Growth
Tax History
| Year | Tax Paid | Tax Assessment Tax Assessment Total Assessment is a certain percentage of the fair market value that is determined by local assessors to be the total taxable value of land and additions on the property. | Land | Improvement |
|---|---|---|---|---|
| 2024 | $1,170 | $10,428 | $2,472 | $7,956 |
| 2023 | $1,170 | $9,931 | $1,741 | $8,190 |
| 2022 | $1,139 | $9,459 | $1,878 | $7,581 |
| 2021 | $1,079 | $9,009 | $2,099 | $6,910 |
| 2020 | $1,031 | $8,580 | $2,140 | $6,440 |
| 2019 | $996 | $8,360 | $1,981 | $6,379 |
| 2018 | $849 | $8,126 | $0 | $0 |
| 2017 | $812 | $7,738 | $1,963 | $5,775 |
| 2016 | $775 | $7,369 | $1,981 | $5,388 |
| 2015 | $769 | $7,262 | $2,059 | $5,203 |
| 2014 | $723 | $7,128 | $2,059 | $5,069 |
Source: Public Records
Map
Nearby Homes
- 6005 NW 58th Terrace
- 5936 N Ione Dr
- 6605 Willowridge Dr
- 5900 NW 62nd St
- 6013 NW 55th St
- 6712 NW 61st St
- 5636 NW 58th Terrace
- 6031 NW 53rd Terrace
- 6203 NW 53rd St Unit 48
- 5932 N Grove Ave
- 6911 NW 59th Terrace
- 6414 Galaxie Terrace
- 5709 NW 64th St
- 6805 NW 64th Terrace Unit 6
- 7007 NW 61st St
- 6815 NW 64th Terrace Unit 1
- 7012 NW 62nd St
- 5905 NW 50th St
- 6808 NW 53rd St
- 6024 NW 50th St
- 6032 NW 59th St
- 5941 NW 59th Ct
- 5937 NW 59th Ct
- 5933 NW 59th Ct
- 5948 N Redmond Ave
- 6036 NW 59th St
- 6025 NW 59th St
- 6029 NW 59th St
- 5944 N Redmond Ave
- 6021 NW 59th St
- 5940 N Redmond Ave
- 6033 NW 59th St
- 5940 NW 59th Ct
- 6017 NW 59th St
- 6037 NW 59th St
- 5936 N Redmond Ave
- 5936 NW 59th Ct
- 6041 NW 59th St
- 5929 NW 59th Ct
- 6013 NW 59th St