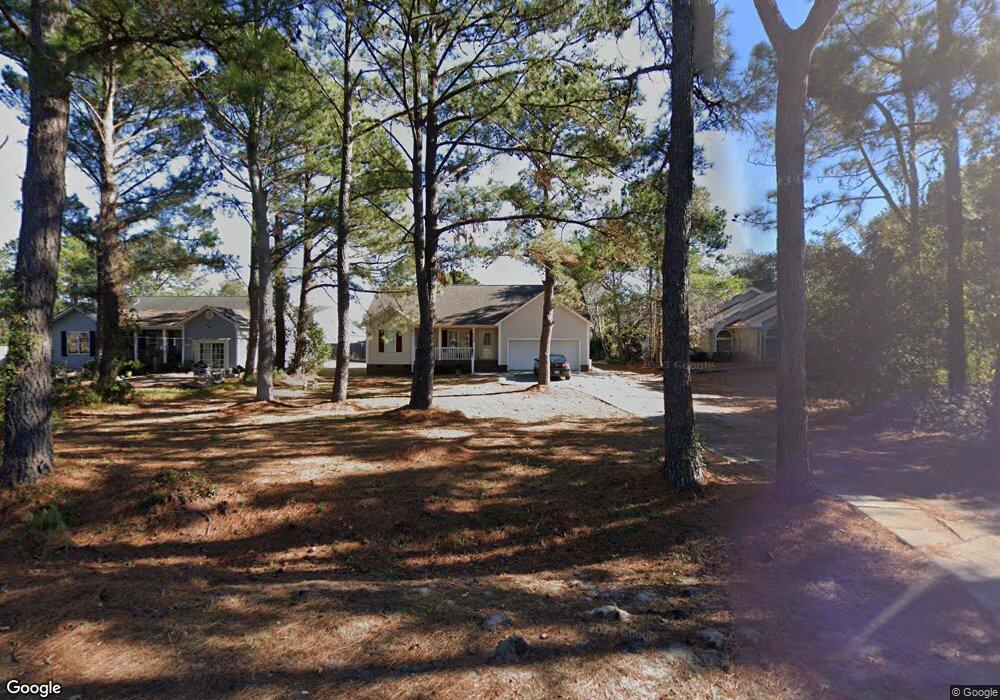
6029 Shiloh Dr Wilmington, NC 28409
Estimated Value: $308,000 - $382,000
3
Beds
2
Baths
1,218
Sq Ft
$278/Sq Ft
Est. Value
About This Home
This home is located at 6029 Shiloh Dr, Wilmington, NC 28409 and is currently estimated at $339,091, approximately $278 per square foot. 6029 Shiloh Dr is a home located in New Hanover County with nearby schools including Heyward C. Bellamy Elementary School, Charles P. Murray Middle School, and Eugene Ashley High School.
Ownership History
Date
Name
Owned For
Owner Type
Purchase Details
Closed on
Mar 30, 2007
Sold by
Stokley Jeffrey M and Stokley Denise B
Bought by
Taber Paul
Current Estimated Value
Purchase Details
Closed on
May 19, 2006
Sold by
Stubbs Debra M
Bought by
The Stokley Family Trust
Purchase Details
Closed on
May 8, 2006
Sold by
Hobbs & Co Of Wilmington Inc
Bought by
Stubbs Debra M
Purchase Details
Closed on
Jun 28, 2001
Sold by
Hobbs Stephen L
Bought by
Taber Paul
Purchase Details
Closed on
Nov 30, 1999
Sold by
Hobbs Lawrence and Nicole Marie J
Bought by
Hobbs Stephen Lawrence
Purchase Details
Closed on
Nov 6, 1996
Sold by
Hobbs James H Jr Bonnie W
Bought by
Hobbs Stephen Lawrence
Purchase Details
Closed on
Sep 28, 1994
Sold by
Hobbs Donna M
Bought by
Hobbs Stephen L
Purchase Details
Closed on
Aug 1, 1988
Sold by
Hobbs Jr J H
Bought by
Hobbs Stephen Lawrence
Purchase Details
Closed on
Aug 1, 1968
Bought by
Hobbs J H
Create a Home Valuation Report for This Property
The Home Valuation Report is an in-depth analysis detailing your home's value as well as a comparison with similar homes in the area
Home Values in the Area
Average Home Value in this Area
Purchase History
| Date | Buyer | Sale Price | Title Company |
|---|---|---|---|
| Taber Paul | -- | None Available | |
| The Stokley Family Trust | $173,000 | None Available | |
| Stubbs Debra M | -- | None Available | |
| Taber Paul | $6,000 | -- | |
| Hobbs Stephen Lawrence | -- | -- | |
| Hobbs Stephen Lawrence | -- | -- | |
| Hobbs Stephen L | -- | -- | |
| Hobbs Stephen Lawrence | -- | -- | |
| Hobbs J H | -- | -- |
Source: Public Records
Tax History Compared to Growth
Tax History
| Year | Tax Paid | Tax Assessment Tax Assessment Total Assessment is a certain percentage of the fair market value that is determined by local assessors to be the total taxable value of land and additions on the property. | Land | Improvement |
|---|---|---|---|---|
| 2023 | $1,096 | $195,600 | $49,100 | $146,500 |
| 2022 | $1,100 | $195,600 | $49,100 | $146,500 |
| 2021 | $1,083 | $195,600 | $49,100 | $146,500 |
| 2020 | $908 | $143,500 | $30,300 | $113,200 |
| 2019 | $908 | $143,500 | $30,300 | $113,200 |
| 2018 | $908 | $143,500 | $30,300 | $113,200 |
| 2017 | $929 | $143,500 | $30,300 | $113,200 |
| 2016 | $930 | $134,200 | $30,300 | $103,900 |
| 2015 | $864 | $134,200 | $30,300 | $103,900 |
| 2014 | $849 | $134,200 | $30,300 | $103,900 |
Source: Public Records
Map
Nearby Homes
- 6046 Shiloh Dr
- 606 Manassas Dr
- 707 Liberty Landing Way
- 6257 Sweet Gum Dr
- 797 Liberty Landing Way
- 443 Lightning Whelk Way
- 445 Lightning Whelk Way Unit 445445
- 1458 Big Cypress Loop
- 6145 Sweet Gum Dr
- 6015 Slipper Shell St
- 6124 Sweet Gum Dr
- 1217 Lt Congleton Rd
- 6117 Ambleside Dr
- 1233 Lt Congleton Rd
- 1016 Rivage Promenade
- 804 Rivage Promenade
- 632 Condo Club Dr Unit 310
- 645 Condo Club Dr Unit 302
- 632 Condo Club Dr Unit 210
- 6416 Ehler Ct
- 6025 Shiloh Dr
- 6033 Shiloh Dr
- 6036 Chancellorsville Dr
- 6032 Chancellorsville Dr
- 6021 Shiloh
- 6037 Shiloh Dr
- 6040 Chancellorsville Dr
- 6061 Shiloh Dr
- 6106 Shiloh Dr
- 6044 Chancellorsville Dr
- 6048 Chancellorsville Dr
- 6024 Chancellorsville Dr
- 6041 Shiloh Dr
- 6017 Shiloh Dr
- 6030 Shiloh Dr
- 6034 Shiloh Dr
- 6052 Chancellorsville Dr
- 6038 Shiloh Dr
- 6022 Shiloh Dr
- 6020 Chancellorsville Dr