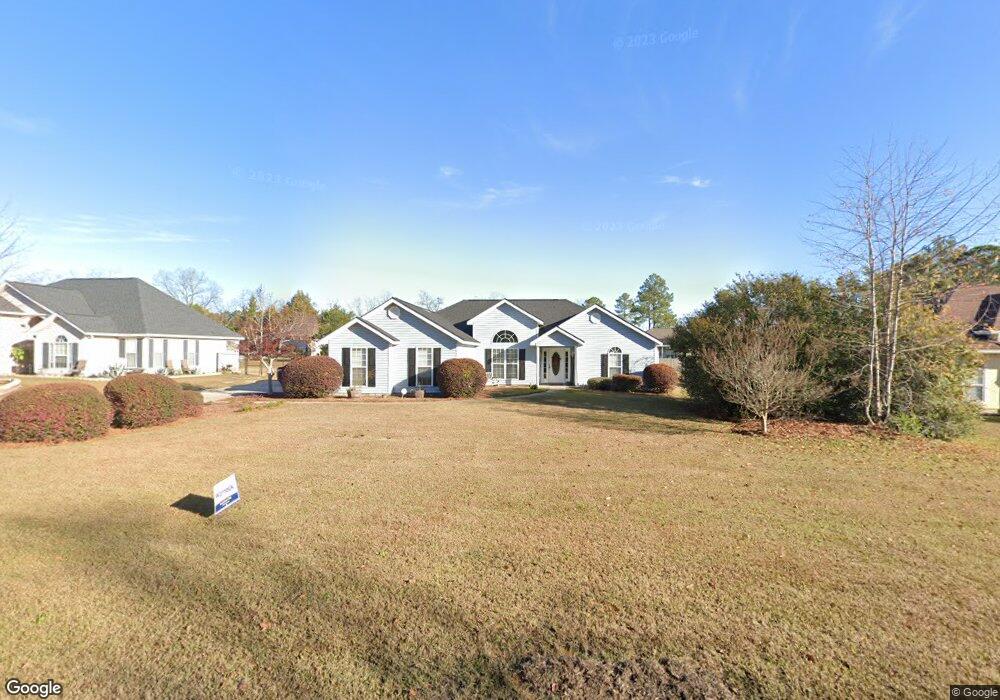
603 48th St Tifton, GA 31794
Estimated Value: $280,000 - $311,000
4
Beds
3
Baths
1,972
Sq Ft
$151/Sq Ft
Est. Value
About This Home
This home is located at 603 48th St, Tifton, GA 31794 and is currently estimated at $297,109, approximately $150 per square foot. 603 48th St is a home located in Tift County with nearby schools including Northside Primary School, Charles Spencer Elementary School, and J.T. Reddick School.
Ownership History
Date
Name
Owned For
Owner Type
Purchase Details
Closed on
Feb 18, 2016
Sold by
Jackson Wayne J
Bought by
Jackson Wayne J and Jackson Twyla S
Current Estimated Value
Purchase Details
Closed on
Oct 30, 2015
Sold by
Christiana Trust /Tr
Bought by
Jackson Wayne J
Home Financials for this Owner
Home Financials are based on the most recent Mortgage that was taken out on this home.
Original Mortgage
$136,482
Interest Rate
4.25%
Mortgage Type
FHA
Purchase Details
Closed on
Mar 3, 2015
Sold by
Odom Reginald
Bought by
Christiana Trust Trustee
Purchase Details
Closed on
Nov 10, 2006
Sold by
Efaw Christopher W
Bought by
Odom Reginal and Odom Teresa
Home Financials for this Owner
Home Financials are based on the most recent Mortgage that was taken out on this home.
Original Mortgage
$145,100
Interest Rate
7.2%
Mortgage Type
New Conventional
Purchase Details
Closed on
Mar 9, 2000
Sold by
Long Roger W
Bought by
Efaw Christopher W
Create a Home Valuation Report for This Property
The Home Valuation Report is an in-depth analysis detailing your home's value as well as a comparison with similar homes in the area
Home Values in the Area
Average Home Value in this Area
Purchase History
| Date | Buyer | Sale Price | Title Company |
|---|---|---|---|
| Jackson Wayne J | -- | -- | |
| Jackson Wayne J | $139,000 | -- | |
| Christiana Trust Trustee | -- | -- | |
| Odom Reginal | $181,400 | -- | |
| Efaw Christopher W | $22,000 | -- |
Source: Public Records
Mortgage History
| Date | Status | Borrower | Loan Amount |
|---|---|---|---|
| Previous Owner | Jackson Wayne J | $136,482 | |
| Previous Owner | Odom Reginal | $145,100 | |
| Previous Owner | Odom Reginal | $36,250 |
Source: Public Records
Tax History Compared to Growth
Tax History
| Year | Tax Paid | Tax Assessment Tax Assessment Total Assessment is a certain percentage of the fair market value that is determined by local assessors to be the total taxable value of land and additions on the property. | Land | Improvement |
|---|---|---|---|---|
| 2024 | $2,831 | $108,863 | $10,000 | $98,863 |
| 2023 | $3,013 | $74,856 | $8,000 | $66,856 |
| 2022 | $2,668 | $74,856 | $8,000 | $66,856 |
| 2021 | $2,685 | $74,856 | $8,000 | $66,856 |
| 2020 | $2,275 | $62,620 | $8,000 | $54,620 |
| 2019 | $2,277 | $62,620 | $8,000 | $54,620 |
| 2018 | $2,277 | $62,620 | $8,000 | $54,620 |
| 2017 | $2,338 | $62,620 | $8,000 | $54,620 |
| 2016 | $2,219 | $62,620 | $8,000 | $54,620 |
| 2015 | $2,344 | $62,620 | $8,000 | $54,620 |
| 2014 | $2,347 | $62,620 | $8,000 | $54,620 |
| 2013 | -- | $62,620 | $8,000 | $54,620 |
Source: Public Records
Map
Nearby Homes
- 346 Somers Ln
- 717 E 44th St
- 714 44th St E
- 0 E 46th St
- 913 E 46th St
- 0 44th St E
- 903 42nd St E
- 4620 Murray Ave
- 153 Belflower Rd
- 2612 Goff St
- 2417 Belmont Ave
- 2411 Davis Ave
- 0 Belflower Rd Unit 25624433
- 0 Belflower Rd Unit 139026
- 0 Belflower Rd Unit 24022932
- 0 Belflower Rd Unit 138547
- 0 Belflower Rd Unit 10554704
- 142 Brighton Rd
- 0 Brighton Rd
- 2214 Love Ave