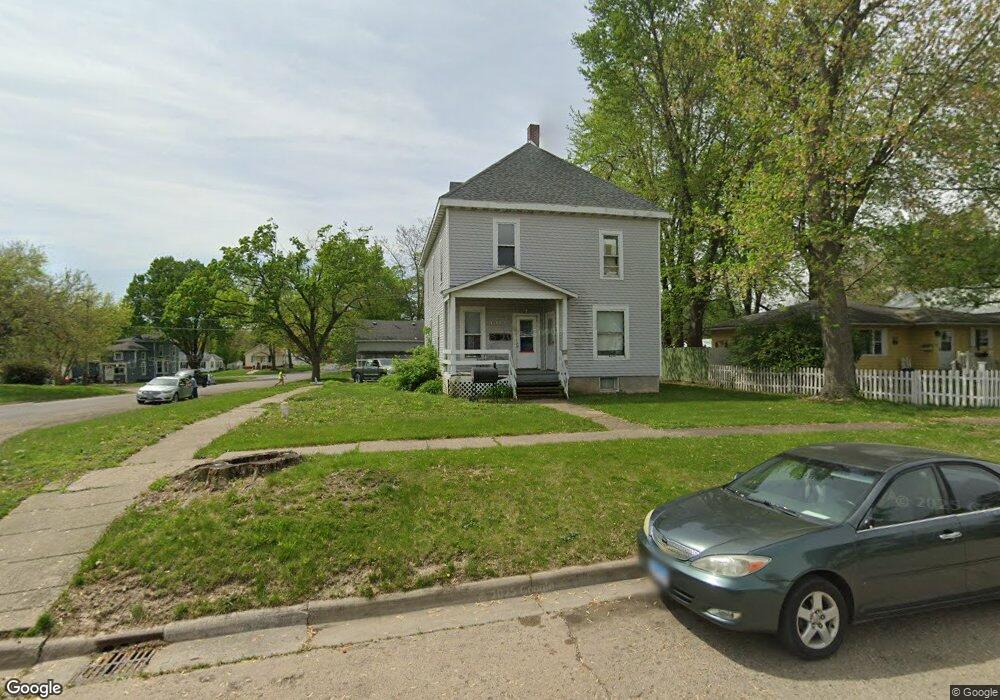
603 4th St Unit 513 south college Lincoln, IL 62656
Estimated Value: $157,000 - $218,000
--
Bed
4
Baths
975
Sq Ft
$185/Sq Ft
Est. Value
About This Home
This home is located at 603 4th St Unit 513 south college, Lincoln, IL 62656 and is currently estimated at $180,488, approximately $185 per square foot. 603 4th St Unit 513 south college is a home located in Logan County with nearby schools including Northwest Elementary School, Lincoln Junior High School, and Lincoln Community High School.
Ownership History
Date
Name
Owned For
Owner Type
Purchase Details
Closed on
Feb 28, 2023
Sold by
Huston Chase
Bought by
Watson Greg
Current Estimated Value
Purchase Details
Closed on
Aug 3, 2022
Sold by
Diana Alice Hasprey Trust
Bought by
Huston Chase A
Home Financials for this Owner
Home Financials are based on the most recent Mortgage that was taken out on this home.
Original Mortgage
$68,000
Interest Rate
5.25%
Mortgage Type
New Conventional
Create a Home Valuation Report for This Property
The Home Valuation Report is an in-depth analysis detailing your home's value as well as a comparison with similar homes in the area
Home Values in the Area
Average Home Value in this Area
Purchase History
| Date | Buyer | Sale Price | Title Company |
|---|---|---|---|
| Watson Greg | $150,000 | Ptax | |
| Huston Chase A | $85,000 | None Available |
Source: Public Records
Mortgage History
| Date | Status | Borrower | Loan Amount |
|---|---|---|---|
| Previous Owner | Huston Chase A | $68,000 |
Source: Public Records
Tax History Compared to Growth
Tax History
| Year | Tax Paid | Tax Assessment Tax Assessment Total Assessment is a certain percentage of the fair market value that is determined by local assessors to be the total taxable value of land and additions on the property. | Land | Improvement |
|---|---|---|---|---|
| 2024 | $5,002 | $55,310 | $6,660 | $48,650 |
| 2023 | $2,503 | $51,220 | $6,170 | $45,050 |
| 2022 | $2,503 | $25,740 | $5,750 | $19,990 |
| 2021 | $2,419 | $24,790 | $5,540 | $19,250 |
| 2020 | $2,424 | $24,790 | $5,540 | $19,250 |
| 2019 | $2,372 | $24,300 | $5,430 | $18,870 |
| 2018 | $2,310 | $23,360 | $5,220 | $18,140 |
| 2017 | $2,297 | $23,360 | $5,220 | $18,140 |
| 2016 | $2,267 | $23,630 | $5,280 | $18,350 |
| 2015 | $2,132 | $22,770 | $5,090 | $17,680 |
| 2014 | $2,132 | $22,770 | $5,090 | $17,680 |
| 2013 | $2,132 | $21,020 | $4,700 | $16,320 |
| 2012 | $2,132 | $21,330 | $4,770 | $16,560 |
Source: Public Records
Map
Nearby Homes