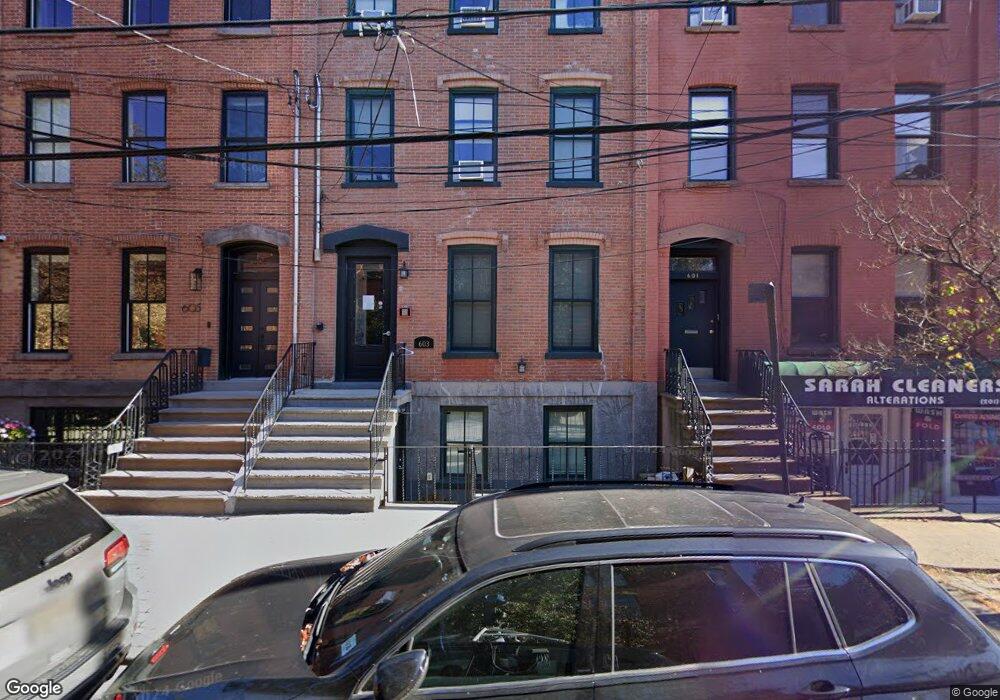
603 Bloomfield St Unit 2 Hoboken, NJ 07030
Estimated Value: $1,668,000 - $2,581,916
2
Beds
1
Bath
550
Sq Ft
$4,030/Sq Ft
Est. Value
About This Home
This home is located at 603 Bloomfield St Unit 2, Hoboken, NJ 07030 and is currently estimated at $2,216,229, approximately $4,029 per square foot. 603 Bloomfield St Unit 2 is a home located in Hudson County with nearby schools including Hoboken High School, Hoboken Charter School, and All Saints Episcopal Day School.
Ownership History
Date
Name
Owned For
Owner Type
Purchase Details
Closed on
Aug 28, 2017
Sold by
Carrington Mortgage Services Llc
Bought by
The Secretary Of Hud
Current Estimated Value
Purchase Details
Closed on
Mar 31, 2015
Sold by
Basterrechea Migdalia
Bought by
Carrington Mortgage Services Llc
Purchase Details
Closed on
Nov 21, 2008
Sold by
Sanchez Teresa
Bought by
Basterrechea Migdalia
Home Financials for this Owner
Home Financials are based on the most recent Mortgage that was taken out on this home.
Original Mortgage
$1,175,212
Interest Rate
6.11%
Mortgage Type
FHA
Purchase Details
Closed on
Aug 1, 2006
Sold by
Chirichella Annette
Bought by
Sanchez Teresa
Home Financials for this Owner
Home Financials are based on the most recent Mortgage that was taken out on this home.
Original Mortgage
$637,500
Interest Rate
6.83%
Mortgage Type
Purchase Money Mortgage
Purchase Details
Closed on
Oct 9, 1995
Sold by
Curcio Mildred
Bought by
Chirichella Annette
Purchase Details
Closed on
Aug 8, 1995
Sold by
Curcio Mildred and Kochan Katherine
Bought by
Curcio Mildred
Create a Home Valuation Report for This Property
The Home Valuation Report is an in-depth analysis detailing your home's value as well as a comparison with similar homes in the area
Home Values in the Area
Average Home Value in this Area
Purchase History
| Date | Buyer | Sale Price | Title Company |
|---|---|---|---|
| The Secretary Of Hud | -- | None Available | |
| Carrington Mortgage Services Llc | $1,250,000 | Attorney | |
| Basterrechea Migdalia | $1,300,000 | -- | |
| Sanchez Teresa | $850,000 | Chicago Title Insurance Co | |
| Chirichella Annette | $85,012 | -- | |
| Curcio Mildred | -- | -- |
Source: Public Records
Mortgage History
| Date | Status | Borrower | Loan Amount |
|---|---|---|---|
| Previous Owner | Basterrechea Migdalia | $1,175,212 | |
| Previous Owner | Sanchez Teresa | $637,500 |
Source: Public Records
Tax History Compared to Growth
Tax History
| Year | Tax Paid | Tax Assessment Tax Assessment Total Assessment is a certain percentage of the fair market value that is determined by local assessors to be the total taxable value of land and additions on the property. | Land | Improvement |
|---|---|---|---|---|
| 2025 | $22,202 | $1,257,200 | $541,500 | $715,700 |
| 2024 | $20,480 | $1,257,200 | $541,500 | $715,700 |
| 2023 | $20,480 | $1,257,200 | $541,500 | $715,700 |
| 2022 | $20,128 | $1,257,200 | $541,500 | $715,700 |
| 2021 | $20,115 | $1,257,200 | $541,500 | $715,700 |
| 2020 | $20,253 | $1,257,200 | $541,500 | $715,700 |
| 2019 | $20,103 | $1,257,200 | $541,500 | $715,700 |
| 2018 | $16,704 | $1,057,200 | $541,500 | $515,700 |
| 2017 | $16,831 | $1,057,200 | $541,500 | $515,700 |
| 2016 | $16,397 | $1,057,200 | $541,500 | $515,700 |
| 2015 | $15,826 | $1,057,200 | $541,500 | $515,700 |
| 2014 | $15,097 | $1,057,200 | $541,500 | $515,700 |
Source: Public Records
Map
Nearby Homes
- 610 Washington St Unit 3
- 606 Bloomfield St
- 107 7th St
- 701 Bloomfield St Unit 2
- 526 Hudson St
- 704 Bloomfield St Unit 2
- 209 6th St Unit 200
- 704 Garden St
- 500 Hudson St Unit 2A
- 500 Hudson St Unit 1
- 208 5th St
- 703 Park Ave Unit 1
- 725 Washington St Unit 5
- 725 Washington St Unit 9
- 264 7th St Unit 3
- 806 Washington St Unit 3
- 812 Bloomfield St Unit 4
- 811 Washington St Unit 5R/10
- 814 Washington St Unit 1
- 821 Bloomfield St
- 603 Bloomfield St
- 603 Bloomfield St Unit 1
- 603 Bloomfield St Unit 1 (GRD)
- 603 Bloomfield St Unit 4
- 603 Bloomfield St Unit 3
- 108 6th St
- 601 Bloomfield St Unit 2
- 601 Bloomfield St Unit 1
- 108 Sixth St
- 605 Bloomfield St
- 106 6th St Unit 1
- 106 6th St Unit 4
- 106 6th St
- 106 6th St
- 106 6th St Unit 2
- 106 6th St Unit 3
- 607 Bloomfield St
- 607 Bloomfield St Unit 3
- 609 Bloomfield St
- 609 Bloomfield St Unit 2