Estimated Value: $76,775 - $171,000
--
Bed
2
Baths
1,024
Sq Ft
$120/Sq Ft
Est. Value
About This Home
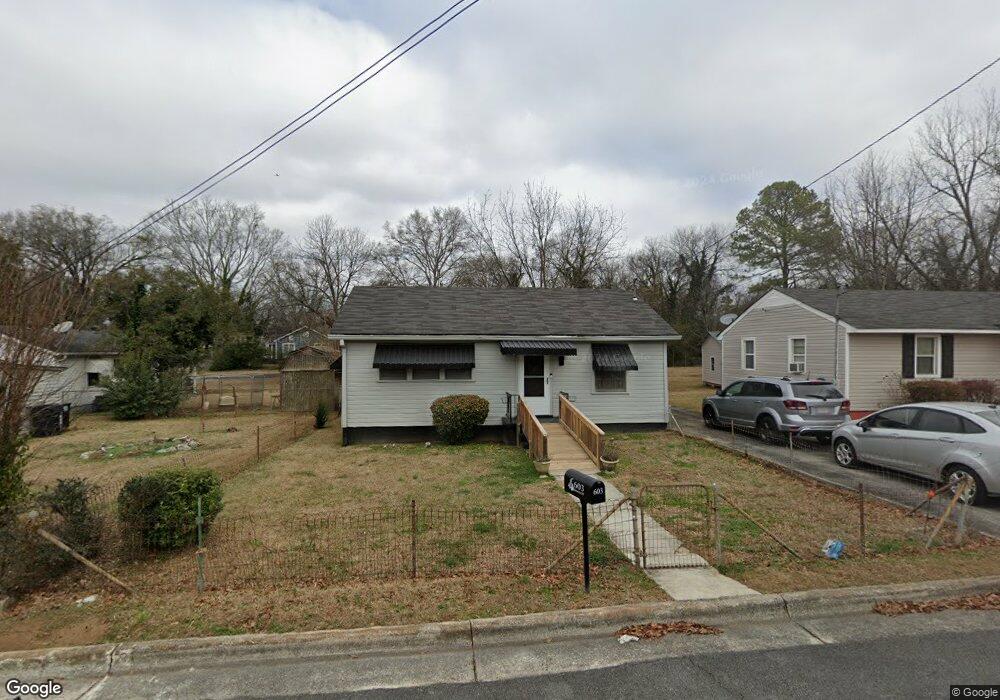
This home is located at 603 Brown St SW, Rome, GA 30161 and is currently estimated at $122,694, approximately $119 per square foot. 603 Brown St SW is a home located in Floyd County with nearby schools including Dan McCarty Middle School, Rome High School, and Montessori School of Rome.
Ownership History
Date
Name
Owned For
Owner Type
Purchase Details
Closed on
Sep 10, 2012
Sold by
Johnson V Della
Bought by
Johnson Hellene J
Current Estimated Value
Purchase Details
Closed on
Sep 4, 2012
Sold by
Best Alice J
Bought by
Johnson V Della
Purchase Details
Closed on
Oct 5, 1965
Sold by
Early John W
Bought by
Johnson Tyler and Johnson Della V
Purchase Details
Closed on
Aug 5, 1963
Sold by
Billings Jack C
Bought by
Early John W
Purchase Details
Closed on
Jan 1, 1901
Bought by
Billings Jack C
Create a Home Valuation Report for This Property
The Home Valuation Report is an in-depth analysis detailing your home's value as well as a comparison with similar homes in the area
Home Values in the Area
Average Home Value in this Area
Purchase History
| Date | Buyer | Sale Price | Title Company |
|---|---|---|---|
| Johnson Hellene J | -- | -- | |
| Johnson V Della | -- | -- | |
| Johnson Tyler | $7,200 | -- | |
| Early John W | -- | -- | |
| P | -- | -- | |
| Billings Jack C | -- | -- |
Source: Public Records
Tax History Compared to Growth
Tax History
| Year | Tax Paid | Tax Assessment Tax Assessment Total Assessment is a certain percentage of the fair market value that is determined by local assessors to be the total taxable value of land and additions on the property. | Land | Improvement |
|---|---|---|---|---|
| 2024 | $384 | $22,684 | $3,696 | $18,988 |
| 2023 | $803 | $21,492 | $3,360 | $18,132 |
| 2022 | $638 | $17,490 | $2,688 | $14,802 |
| 2021 | $586 | $15,797 | $2,688 | $13,109 |
| 2020 | $538 | $14,377 | $2,100 | $12,277 |
| 2019 | $501 | $13,546 | $2,100 | $11,446 |
| 2018 | $466 | $12,582 | $2,100 | $10,482 |
| 2017 | $448 | $12,091 | $2,100 | $9,991 |
| 2016 | $436 | $11,747 | $2,080 | $9,667 |
| 2015 | $412 | $11,747 | $2,080 | $9,667 |
| 2014 | $412 | $11,747 | $2,080 | $9,667 |
Source: Public Records
Map
Nearby Homes
- 414 E 17th St SW
- 1705 Olmstead St SW
- 1502 Spring Creek St SW
- 4 E 15th St SW
- 000 E Oglethorpe Hwy
- 304 E 19th St SW
- 39 E 16th St SW
- 111 Hosea St SW
- 14 Clover St SW
- 2014 Maple Ave SW
- 1901 Hull Ave SW
- 1314 E 2nd Ave SE
- 2512 Callier Springs Rd SE
- 106 E 14th St SW
- 2108 Maple Ave SW
- 13 Townview Rd SE
- 31 Notasulga Dr SW
- 170 E 11th St SW
- 168 E 11th St SE
- 605 Brown St SW
- 605 Brown St SW
- 601 Brown St SW
- 1809 Flannery St SW
- 1801 Flannery St SW
- 1801 Flannery St SW
- 604 Brown St SW
- 1813 Flannery St SW
- 609 Brown St SW
- 609 Brown St SW
- 515 Brown St SW
- 606 Brown St SW
- 1713 Flannery St SW
- 418 E 18th St SW
- 611 Brown St SW
- 1815 Flannery St SW
- 1814 Flannery St SW
- 610 Brown St SW
- 610 Brown St SW
- 1711 Flannery St SW