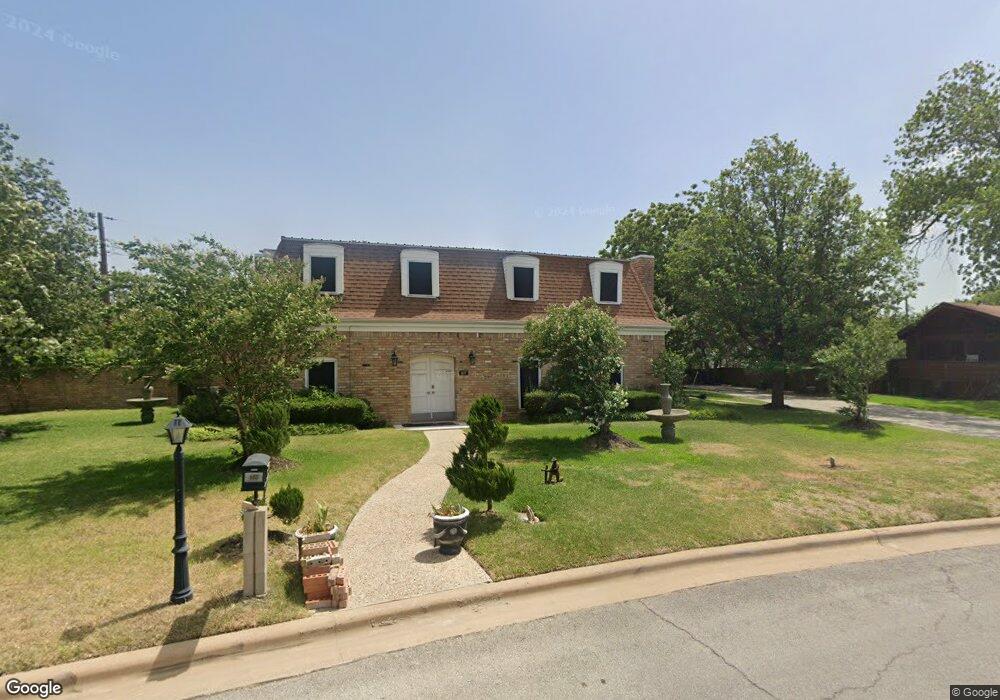
603 Cedar Dr Copperas Cove, TX 76522
Estimated Value: $369,648 - $393,000
4
Beds
5
Baths
3,477
Sq Ft
$110/Sq Ft
Est. Value
About This Home
This home is located at 603 Cedar Dr, Copperas Cove, TX 76522 and is currently estimated at $381,324, approximately $109 per square foot. 603 Cedar Dr is a home located in Coryell County with nearby schools including C.R. Clements/Hollie Parsons Elementary School, Copperas Cove Junior High School, and Copperas Cove High School.
Ownership History
Date
Name
Owned For
Owner Type
Purchase Details
Closed on
Nov 7, 2014
Sold by
Windbell Enterprises Ltd
Bought by
Mebane Dr Warren
Current Estimated Value
Home Financials for this Owner
Home Financials are based on the most recent Mortgage that was taken out on this home.
Original Mortgage
$96,195
Outstanding Balance
$74,255
Interest Rate
4.21%
Estimated Equity
$307,069
Purchase Details
Closed on
Jul 1, 2014
Sold by
Hayghe Joseph F and Hayghe Katherine J
Bought by
Windbell Enterprises Ltd
Purchase Details
Closed on
Apr 6, 2011
Sold by
Duren Dorothy Joann
Bought by
Hayghe Joseph F
Home Financials for this Owner
Home Financials are based on the most recent Mortgage that was taken out on this home.
Original Mortgage
$214,412
Interest Rate
4.98%
Create a Home Valuation Report for This Property
The Home Valuation Report is an in-depth analysis detailing your home's value as well as a comparison with similar homes in the area
Home Values in the Area
Average Home Value in this Area
Purchase History
| Date | Buyer | Sale Price | Title Company |
|---|---|---|---|
| Mebane Dr Warren | -- | Centra Land Title Company | |
| Windbell Enterprises Ltd | $115,243 | None Available | |
| Windbell Enterprises Ltd | $115,243 | None Available | |
| Windbell Enterprises Ltd | $115,243 | None Available | |
| Hayghe Joseph F | -- | None Available | |
| Hayghe Joseph F | -- | -- |
Source: Public Records
Mortgage History
| Date | Status | Borrower | Loan Amount |
|---|---|---|---|
| Open | Mebane Dr Warren | $96,195 | |
| Previous Owner | Hayghe Joseph F | $214,412 |
Source: Public Records
Tax History Compared to Growth
Tax History
| Year | Tax Paid | Tax Assessment Tax Assessment Total Assessment is a certain percentage of the fair market value that is determined by local assessors to be the total taxable value of land and additions on the property. | Land | Improvement |
|---|---|---|---|---|
| 2025 | $2,404 | $335,436 | -- | -- |
| 2023 | $2,404 | $277,220 | $0 | $0 |
| 2022 | $5,654 | $341,090 | $60,000 | $281,090 |
| 2021 | $5,905 | $268,330 | $31,000 | $237,330 |
| 2020 | $5,860 | $223,779 | $31,000 | $192,779 |
| 2019 | $5,808 | $217,260 | $31,000 | $186,260 |
| 2018 | $5,322 | $196,140 | $31,000 | $165,140 |
| 2017 | $5,216 | $196,140 | $31,000 | $165,140 |
| 2016 | $5,216 | $196,140 | $31,000 | $165,140 |
| 2015 | $4,165 | $176,880 | $27,130 | $149,750 |
| 2014 | $4,165 | $159,270 | $15,500 | $143,770 |
Source: Public Records
Map
Nearby Homes