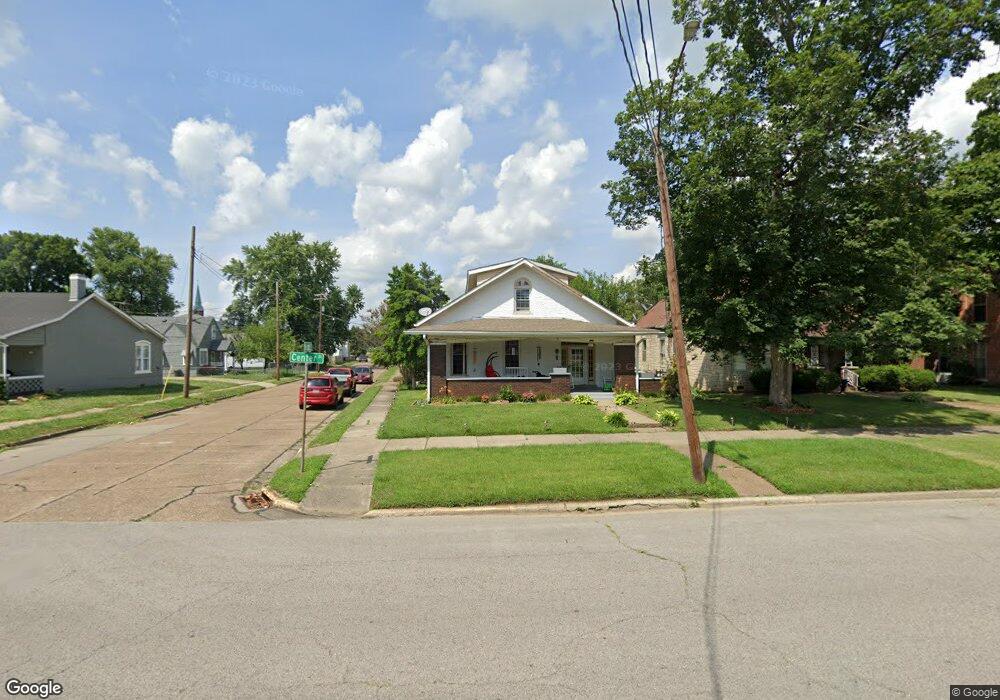
603 Center St Henderson, KY 42420
Henderson East End NeighborhoodEstimated Value: $111,000 - $133,000
--
Bed
--
Bath
1,615
Sq Ft
$74/Sq Ft
Est. Value
About This Home
This home is located at 603 Center St, Henderson, KY 42420 and is currently estimated at $120,006, approximately $74 per square foot. 603 Center St is a home with nearby schools including Jefferson Elementary School, Henderson County South Middle School, and Henderson County High School.
Ownership History
Date
Name
Owned For
Owner Type
Purchase Details
Closed on
May 24, 2024
Sold by
William E Woodard Jr Living Trust and Woodard William E
Bought by
Bt Real Estate Llc
Current Estimated Value
Purchase Details
Closed on
Sep 28, 2015
Sold by
Pregnancy Resource Center Inc
Bought by
Woodard William E and Woodard Heather R
Home Financials for this Owner
Home Financials are based on the most recent Mortgage that was taken out on this home.
Original Mortgage
$46,750
Interest Rate
3.97%
Mortgage Type
Commercial
Create a Home Valuation Report for This Property
The Home Valuation Report is an in-depth analysis detailing your home's value as well as a comparison with similar homes in the area
Home Values in the Area
Average Home Value in this Area
Purchase History
| Date | Buyer | Sale Price | Title Company |
|---|---|---|---|
| Bt Real Estate Llc | -- | None Listed On Document | |
| Woodard William E | $55,000 | None Available |
Source: Public Records
Mortgage History
| Date | Status | Borrower | Loan Amount |
|---|---|---|---|
| Previous Owner | Woodard William E | $46,750 |
Source: Public Records
Tax History Compared to Growth
Tax History
| Year | Tax Paid | Tax Assessment Tax Assessment Total Assessment is a certain percentage of the fair market value that is determined by local assessors to be the total taxable value of land and additions on the property. | Land | Improvement |
|---|---|---|---|---|
| 2024 | $730 | $66,000 | $0 | $0 |
| 2023 | $738 | $66,000 | $0 | $0 |
| 2022 | $731 | $66,000 | $0 | $0 |
| 2021 | $732 | $66,000 | $0 | $0 |
| 2020 | $715 | $66,000 | $0 | $0 |
| 2019 | $702 | $66,000 | $0 | $0 |
| 2018 | $703 | $66,000 | $0 | $0 |
| 2017 | $688 | $55,000 | $0 | $0 |
| 2016 | $543 | $55,000 | $0 | $0 |
| 2014 | -- | $65,000 | $7,000 | $58,000 |
Source: Public Records
Map
Nearby Homes