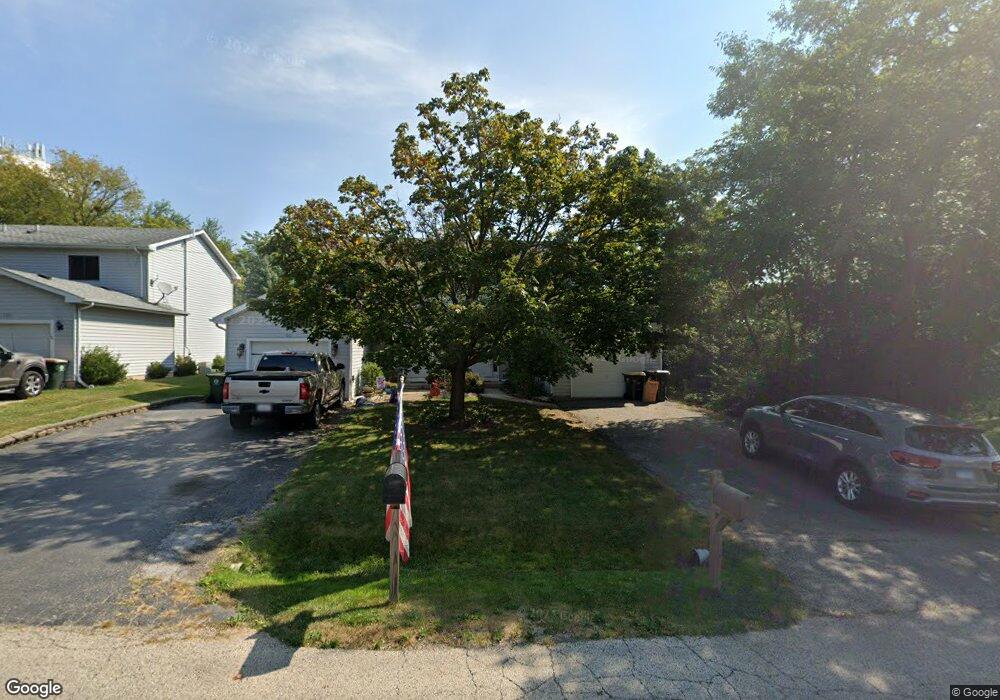
603 Drom Ct Antioch, IL 60002
Estimated Value: $245,000 - $299,000
2
Beds
2
Baths
1,320
Sq Ft
$206/Sq Ft
Est. Value
About This Home
This home is located at 603 Drom Ct, Antioch, IL 60002 and is currently estimated at $271,390, approximately $205 per square foot. 603 Drom Ct is a home located in Lake County with nearby schools including Antioch Community High School.
Ownership History
Date
Name
Owned For
Owner Type
Purchase Details
Closed on
Jun 15, 2017
Sold by
Worklan Patrick
Bought by
Rodriguez Luis M and Rodriguez Taylor M
Current Estimated Value
Home Financials for this Owner
Home Financials are based on the most recent Mortgage that was taken out on this home.
Original Mortgage
$124,896
Outstanding Balance
$104,535
Interest Rate
4.25%
Mortgage Type
FHA
Estimated Equity
$166,855
Purchase Details
Closed on
May 18, 2004
Sold by
Lasalle Bank Na
Bought by
Worklan Patrick
Home Financials for this Owner
Home Financials are based on the most recent Mortgage that was taken out on this home.
Original Mortgage
$112,960
Interest Rate
3.5%
Mortgage Type
Unknown
Purchase Details
Closed on
Oct 21, 1997
Sold by
Anderson Judith E
Bought by
Wilgenbusch Darlene E
Home Financials for this Owner
Home Financials are based on the most recent Mortgage that was taken out on this home.
Original Mortgage
$86,400
Interest Rate
7.65%
Create a Home Valuation Report for This Property
The Home Valuation Report is an in-depth analysis detailing your home's value as well as a comparison with similar homes in the area
Home Values in the Area
Average Home Value in this Area
Purchase History
| Date | Buyer | Sale Price | Title Company |
|---|---|---|---|
| Rodriguez Luis M | $127,200 | First American Title | |
| Worklan Patrick | $141,500 | -- | |
| Wilgenbusch Darlene E | $75,666 | -- |
Source: Public Records
Mortgage History
| Date | Status | Borrower | Loan Amount |
|---|---|---|---|
| Open | Rodriguez Luis M | $124,896 | |
| Previous Owner | Worklan Patrick | $112,960 | |
| Previous Owner | Wilgenbusch Darlene E | $86,400 |
Source: Public Records
Tax History Compared to Growth
Tax History
| Year | Tax Paid | Tax Assessment Tax Assessment Total Assessment is a certain percentage of the fair market value that is determined by local assessors to be the total taxable value of land and additions on the property. | Land | Improvement |
|---|---|---|---|---|
| 2024 | $6,241 | $63,318 | $3,732 | $59,586 |
| 2023 | $5,678 | $56,696 | $3,342 | $53,354 |
| 2022 | $5,678 | $50,555 | $4,904 | $45,651 |
| 2021 | $5,291 | $47,173 | $4,576 | $42,597 |
| 2020 | $5,194 | $45,871 | $4,450 | $41,421 |
| 2019 | $5,280 | $43,867 | $4,256 | $39,611 |
| 2018 | $4,564 | $41,658 | $4,324 | $37,334 |
| 2017 | $4,158 | $39,652 | $4,116 | $35,536 |
| 2016 | $4,040 | $38,267 | $3,972 | $34,295 |
| 2015 | $3,936 | $37,294 | $3,871 | $33,423 |
| 2014 | $3,437 | $35,607 | $6,184 | $29,423 |
| 2012 | $3,186 | $35,607 | $6,184 | $29,423 |
Source: Public Records
Map
Nearby Homes
- 602 Anita Ave
- 394 Birchwood Dr
- 770 Anita Ave
- 672 Garys Dr
- 56 Burnette Dr
- 68 Burnette Dr
- 52 Burnette Dr
- 45 Van Dyke Dr
- 324 Elmwood Ln
- 150 E Depot St
- 44 Burnette Dr
- 49 Burnette Dr
- 152 E Depot St
- 36 Burnette Dr
- 188 Oakwood Dr
- 582 Phillips Cir
- 425 Joren Trail
- 198 Bridgewood Dr
- 558 1st St
- 0 Anita Ave Unit MRD12354735