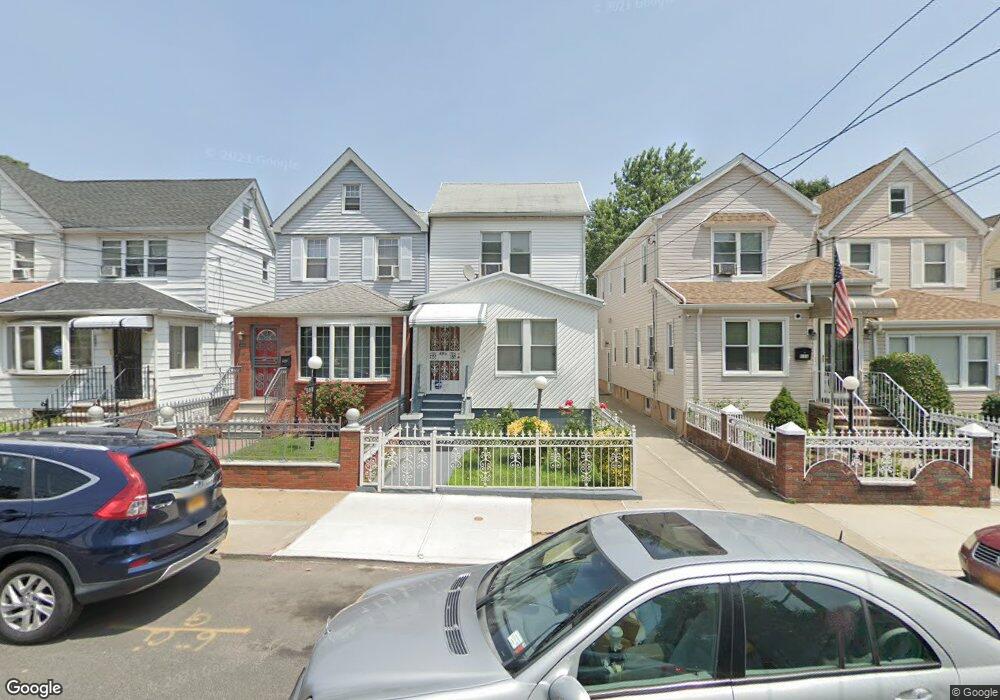
603 E 43rd St Brooklyn, NY 11203
East Flatbush NeighborhoodEstimated Value: $684,801 - $938,000
Studio
--
Bath
1,616
Sq Ft
$487/Sq Ft
Est. Value
About This Home
This home is located at 603 E 43rd St, Brooklyn, NY 11203 and is currently estimated at $787,450, approximately $487 per square foot. 603 E 43rd St is a home located in Kings County with nearby schools including P.S. 109, Andries Hudde School, and Central Brooklyn Ascend Charter.
Ownership History
Date
Name
Owned For
Owner Type
Purchase Details
Closed on
Nov 4, 2005
Sold by
Henry Trudy and Mills Jean
Bought by
Mills Jean
Current Estimated Value
Purchase Details
Closed on
Apr 27, 1997
Sold by
Morisset Guy
Bought by
Blanchet Renoux and Gourdet Mona
Home Financials for this Owner
Home Financials are based on the most recent Mortgage that was taken out on this home.
Original Mortgage
$108,750
Interest Rate
7.97%
Create a Home Valuation Report for This Property
The Home Valuation Report is an in-depth analysis detailing your home's value as well as a comparison with similar homes in the area
Home Values in the Area
Average Home Value in this Area
Purchase History
We collect this data history from publicly available records. To have your information removed, we recommend requesting removal directly through your county’s website.
| Date | Buyer | Sale Price | Title Company |
|---|---|---|---|
| Mills Jean | -- | -- | |
| Mills Jean | -- | -- | |
| Blanchet Renoux | $145,000 | American Title Ins Co | |
| Blanchet Renoux | $145,000 | American Title Ins Co |
Source: Public Records
Mortgage History
We collect this data history from publicly available records. To have your information removed, we recommend requesting removal directly through your county’s website.
| Date | Status | Borrower | Loan Amount |
|---|---|---|---|
| Previous Owner | Blanchet Renoux | $108,750 | |
| Closed | Blanchet Renoux | $7,250 |
Source: Public Records
Tax History
| Year | Tax Paid | Tax Assessment Tax Assessment Total Assessment is a certain percentage of the fair market value that is determined by local assessors to be the total taxable value of land and additions on the property. | Land | Improvement |
|---|---|---|---|---|
| 2026 | $5,860 | $47,940 | $13,380 | $34,560 |
| 2025 | $5,516 | $48,840 | $13,380 | $35,460 |
| 2024 | $5,516 | $45,660 | $13,380 | $32,280 |
| 2023 | $5,436 | $43,920 | $13,380 | $30,540 |
| 2022 | $5,273 | $41,520 | $13,380 | $28,140 |
| 2021 | $5,234 | $37,740 | $13,380 | $24,360 |
| 2020 | $2,519 | $31,560 | $13,380 | $18,180 |
| 2019 | $4,739 | $29,160 | $13,380 | $15,780 |
| 2018 | $4,487 | $23,472 | $8,361 | $15,111 |
| 2017 | $4,431 | $23,208 | $10,715 | $12,493 |
| 2016 | $4,067 | $21,896 | $10,851 | $11,045 |
| 2015 | $2,421 | $21,246 | $13,339 | $7,907 |
| 2014 | $2,421 | $20,044 | $11,145 | $8,899 |
Source: Public Records
Map
Nearby Homes
- 627 E 42nd St
- 1352 Troy Ave
- 1359 Albany Ave
- 4122 Avenue D
- 661 E 43rd St
- 4406 Foster Ave
- 1246 Troy Ave
- 1245 Troy Ave
- 868 E 46th St
- 680 E 42nd St
- 1278 Schenectady Ave
- 4623 Avenue D
- 3906 Avenue D
- 846 E 48th St
- 4404 Clarendon Rd
- 872 E 48th St
- 515 E 40th St
- 1214 Schenectady Ave
- 712 E 40th St
- 4510 Clarendon Rd
Your Personal Tour Guide
Ask me questions while you tour the home.