
Seller's Agent in 2021
Debbie Brown
Ward Realty Services
(502) 794-4097
11 in this area
152 Total Sales
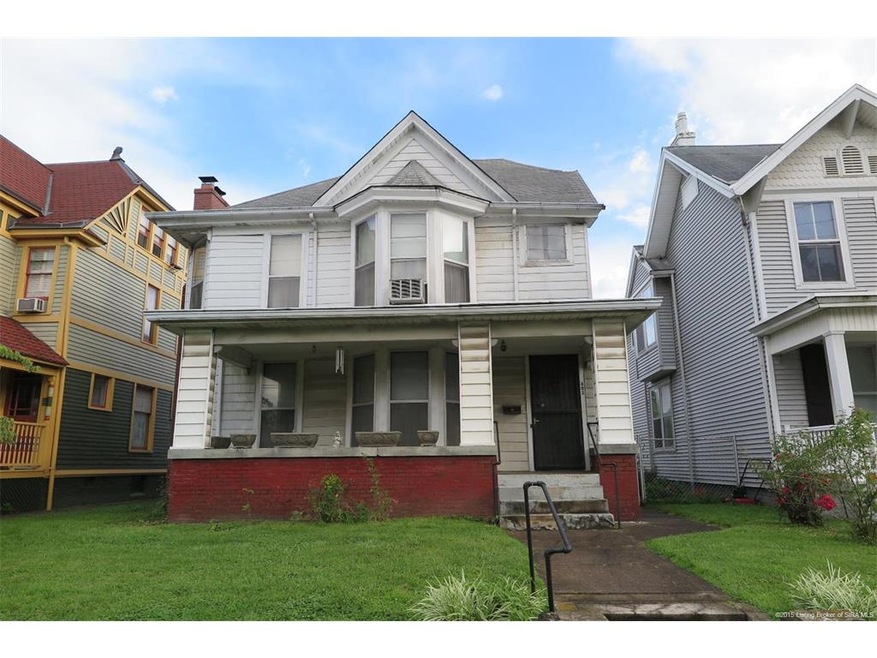
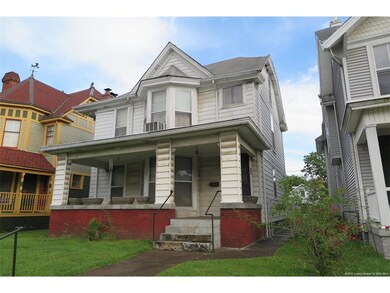
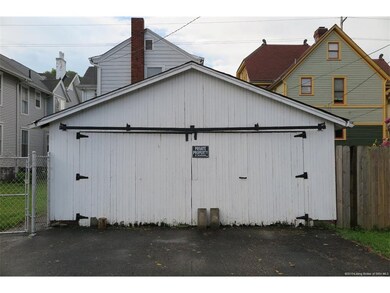
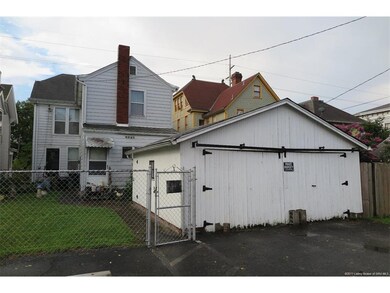
Absolute Real Estate Auction Saturday, August 20th at 9am.(Real Estate sells @ 11am).Selling absolute without reserve a spacious turn of the century 2876 SF home w/covered front porch, basement and detached 2-car garage on 48x120 lot located within the Mansion Row Historic District. Home features 1438 SF per floor and includes large eat-in kitchen, full bath, dining, living and family rooms on first floor and 3 bedrooms, 2 kitchen areas and 2 full baths upstairs(formerly used as apartments)plus partial unfinished basement & 20x20 garage with alley access. Home in need of renovation. Any exterior alterations to building must be reviewed and approved in advance by the city's Historic Preservation Commission. Design guidelines are available on the Commission's website at www.newalbanypreservation.com. Selling as is with no contingencies. Inspections welcomed. 10% non-refundable down payment auction day balance in 40 days. SF of home and lot size per courthouse records. Open 8/10/16,5-7PM.
Last Agent to Sell the Property
Harritt Group, Inc License #RB14019478 Listed on: 08/01/2016
| Date | Type | Sale Price | Title Company |
|---|---|---|---|
| Warranty Deed | $850,000 | None Available | |
| Interfamily Deed Transfer | -- | None Available | |
| Warranty Deed | -- | -- | |
| Warranty Deed | -- | -- |
| Date | Status | Loan Amount | Loan Type |
|---|---|---|---|
| Open | $403,750 | New Conventional | |
| Previous Owner | $175,000 | New Conventional | |
| Previous Owner | $62,400 | New Conventional |
| Date | Event | Price | Change | Sq Ft Price |
|---|---|---|---|---|
| 09/30/2021 09/30/21 | Sold | $425,000 | 0.0% | $115 / Sq Ft |
| 08/23/2021 08/23/21 | Pending | -- | -- | -- |
| 08/20/2021 08/20/21 | For Sale | $424,900 | +304.7% | $115 / Sq Ft |
| 10/13/2016 10/13/16 | Sold | $105,000 | +34.6% | $36 / Sq Ft |
| 10/06/2016 10/06/16 | Pending | -- | -- | -- |
| 09/22/2016 09/22/16 | Sold | $78,000 | -34.9% | $27 / Sq Ft |
| 09/22/2016 09/22/16 | For Sale | $119,900 | +53.7% | $41 / Sq Ft |
| 08/20/2016 08/20/16 | Pending | -- | -- | -- |
| 08/01/2016 08/01/16 | For Sale | $78,000 | -- | $27 / Sq Ft |
| Year | Tax Paid | Tax Assessment Tax Assessment Total Assessment is a certain percentage of the fair market value that is determined by local assessors to be the total taxable value of land and additions on the property. | Land | Improvement |
|---|---|---|---|---|
| 2024 | $1,823 | $168,900 | $18,600 | $150,300 |
| 2023 | $1,823 | $172,300 | $18,600 | $153,700 |
| 2022 | $1,765 | $166,200 | $18,600 | $147,600 |
| 2021 | $1,637 | $153,400 | $18,600 | $134,800 |
| 2020 | $1,639 | $153,400 | $18,600 | $134,800 |
| 2019 | $1,640 | $153,400 | $18,600 | $134,800 |
| 2018 | $1,639 | $152,000 | $18,600 | $133,400 |
| 2017 | $2,399 | $152,300 | $18,600 | $133,700 |
| 2016 | $1,339 | $150,900 | $18,600 | $132,300 |
| 2014 | $483 | $92,500 | $18,600 | $73,900 |
| 2013 | -- | $90,100 | $18,600 | $71,500 |
Seller's Agent in 2021
Debbie Brown
Ward Realty Services
(502) 794-4097
11 in this area
152 Total Sales
K
Buyer's Agent in 2021
Kymberli Quinn
Schuler Bauer Real Estate Services ERA Powered
(502) 639-0888
5 in this area
10 Total Sales
M
Seller's Agent in 2016
Matt Schaefer
Schaefer Real Estate
(502) 552-4842
27 in this area
75 Total Sales
Seller's Agent in 2016
Douglas Harritt
Harritt Group, Inc
(502) 592-4000
40 in this area
186 Total Sales
Buyer's Agent in 2016
Greg Taylor
Semonin Realty
(502) 599-1700
5 in this area
135 Total Sales
Source: Southern Indiana REALTORS® Association
MLS Number: 201605033
APN: 22-05-00-200-832.000-008
Disclaimer: Certain information contained herein is derived from information provided by parties other than Homes.com. All information provided is deemed reliable, but is not guaranteed to be accurate and should be independently verified.
![]() IDX information is provided exclusively for consumers’ personal, noncommercial use, and it may not be used for any purpose other than to identify prospective properties consumers may be interested in purchasing. Listing data is deemed reliable but is not guaranteed accurate by the SIRA MLS.
IDX information is provided exclusively for consumers’ personal, noncommercial use, and it may not be used for any purpose other than to identify prospective properties consumers may be interested in purchasing. Listing data is deemed reliable but is not guaranteed accurate by the SIRA MLS.