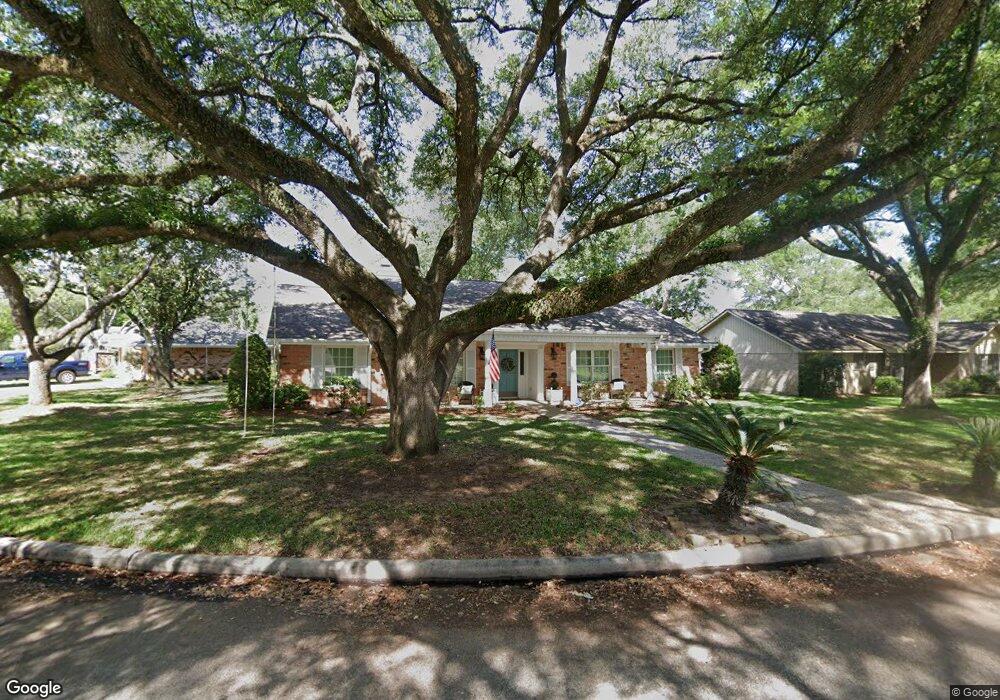
603 E Pecan Dr Tomball, TX 77375
Estimated Value: $314,314 - $384,000
3
Beds
2
Baths
2,048
Sq Ft
$170/Sq Ft
Est. Value
About This Home
This home is located at 603 E Pecan Dr, Tomball, TX 77375 and is currently estimated at $347,579, approximately $169 per square foot. 603 E Pecan Dr is a home located in Harris County with nearby schools including Tomball Elementary School, Tomball Intermediate School, and Tomball Junior High School.
Ownership History
Date
Name
Owned For
Owner Type
Purchase Details
Closed on
Dec 21, 2021
Sold by
Zimmerman Chris L and Zimmerman Kaitlin N
Bought by
Zimmerman Christopher Lee and Zimmerman Kaitlin Nicole
Current Estimated Value
Purchase Details
Closed on
Feb 18, 2015
Sold by
Parker Ronald F and Parker Terry L
Bought by
Zimmerman Chris L and Zimmerman Kaitlin N
Home Financials for this Owner
Home Financials are based on the most recent Mortgage that was taken out on this home.
Original Mortgage
$79,000
Outstanding Balance
$60,329
Interest Rate
3.68%
Mortgage Type
New Conventional
Estimated Equity
$287,250
Purchase Details
Closed on
Jun 7, 2001
Sold by
Parker Poley and Parker Juanita C
Bought by
Parker Napoleon and Juanita Parker Revocable Living Trust
Create a Home Valuation Report for This Property
The Home Valuation Report is an in-depth analysis detailing your home's value as well as a comparison with similar homes in the area
Home Values in the Area
Average Home Value in this Area
Purchase History
| Date | Buyer | Sale Price | Title Company |
|---|---|---|---|
| Zimmerman Christopher Lee | -- | None Available | |
| Zimmerman Chris L | -- | None Available | |
| Parker Napoleon | -- | -- |
Source: Public Records
Mortgage History
| Date | Status | Borrower | Loan Amount |
|---|---|---|---|
| Open | Zimmerman Chris L | $79,000 |
Source: Public Records
Tax History
| Year | Tax Paid | Tax Assessment Tax Assessment Total Assessment is a certain percentage of the fair market value that is determined by local assessors to be the total taxable value of land and additions on the property. | Land | Improvement |
|---|---|---|---|---|
| 2025 | $4,959 | $255,608 | $96,187 | $159,421 |
| 2024 | $4,959 | $255,608 | $96,187 | $159,421 |
| 2023 | $4,959 | $272,524 | $96,187 | $176,337 |
| 2022 | $4,998 | $233,935 | $56,199 | $177,736 |
| 2021 | $4,781 | $201,572 | $43,230 | $158,342 |
| 2020 | $4,944 | $201,572 | $43,230 | $158,342 |
| 2019 | $4,783 | $189,583 | $43,230 | $146,353 |
| 2018 | $2,488 | $198,163 | $30,261 | $167,902 |
| 2017 | $4,705 | $186,710 | $30,261 | $156,449 |
| 2016 | $4,705 | $186,710 | $30,261 | $156,449 |
| 2015 | $737 | $186,710 | $30,261 | $156,449 |
| 2014 | $737 | $158,326 | $30,261 | $128,065 |
Source: Public Records
Map
Nearby Homes
- 302 Epps St
- 18818 Cornelia Fields Ln
- 18723 Buttercup Farms Ln
- 2235 Cold Stream Ln
- 19935 Epona Creek Dr
- 18707 Buttercup Farms Ln
- 18826 Cornelia Fields Ln
- 410 N Peach St
- 0 N Sycamore St
- 200 S Cherry St
- 221 Carrell St
- 508 Clarence St
- 701 Malone St
- 214 Texas St
- 712 Clarence St
- 504 Percival St Unit A
- Lot 46 Moore St
- Lot 45 Moore St
- 614 Percival St
- 10615 N Chestnut St
- 607 E Pecan Dr
- 602 N Hickory St
- 610 N Hickory St
- 407 N Pecan Dr
- 407 S Pecan Dr
- 411 N Pecan Dr
- 403 S Pecan Dr
- 606 E Pecan Dr
- 614 N Hickory St
- 602 E Pecan Dr
- 411 S Pecan Dr
- 610 E Pecan Dr
- 618 N Hickory St
- 614 E Pecan Dr
- 419 S Pecan Dr
- 603 N Hickory St
- 607 N Hickory St
- 410 N Pecan Dr
- 611 N Hickory St
- 402 N Pecan Dr
Your Personal Tour Guide
Ask me questions while you tour the home.