603 E Yale St Ontario, CA 91764
Downtown Ontario NeighborhoodEstimated Value: $546,222 - $648,000
About This Home
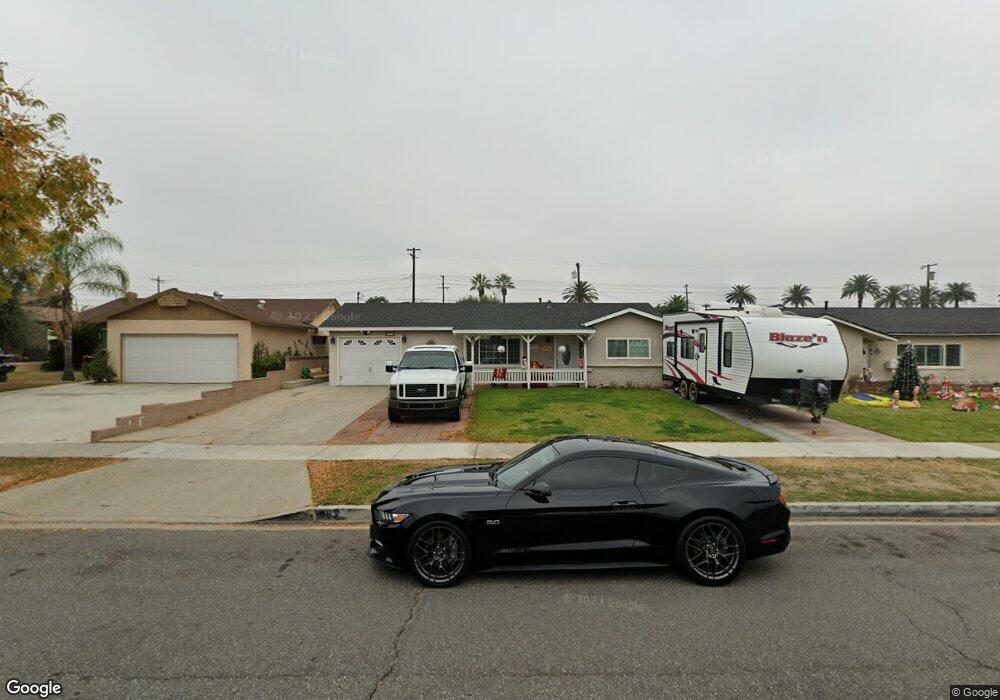
This home is located at 603 E Yale St, Ontario, CA 91764 and is currently estimated at $608,056, approximately $658 per square foot. 603 E Yale St is a home located in San Bernardino County with nearby schools including Edison Elementary School, Vina Danks Middle, and Chaffey High School.
Ownership History
We collect this data history from publicly available records. To have your information removed, we recommend requesting removal directly through your county’s website.
Purchase Details
Purchase Details
Home Financials for this Owner
Home Financials are based on the most recent Mortgage that was taken out on this home.Home Values in the Area
Average Home Value in this Area
Purchase History
We collect this data history from publicly available records. To have your information removed, we recommend requesting removal directly through your county’s website.
| Date | Buyer | Sale Price | Title Company |
|---|---|---|---|
| -- | None Listed On Document | ||
| $126,500 | Fidelity National Title Ins |
Mortgage History
We collect this data history from publicly available records. To have your information removed, we recommend requesting removal directly through your county’s website.
| Date | Status | Borrower | Loan Amount |
|---|---|---|---|
| Previous Owner | $218,400 | ||
| Previous Owner | $225,600 | ||
| Previous Owner | $80,000 | ||
| Previous Owner | $156,000 | ||
| Previous Owner | $125,659 |
Tax History
We collect this data history from publicly available records. To have your information removed, we recommend requesting removal directly through your county’s website.
| Year | Tax Paid | Tax Assessment Tax Assessment Total Assessment is a certain percentage of the fair market value that is determined by local assessors to be the total taxable value of land and additions on the property. | Land | Improvement |
|---|---|---|---|---|
| 2026 | $2,490 | $236,941 | $68,048 | $168,893 |
| 2025 | $2,490 | $232,295 | $66,714 | $165,581 |
| 2024 | $2,432 | $227,740 | $65,406 | $162,334 |
| 2023 | $2,362 | $223,275 | $64,124 | $159,151 |
| 2022 | $2,329 | $218,897 | $62,867 | $156,030 |
| 2021 | $2,313 | $214,605 | $61,634 | $152,971 |
| 2020 | $2,272 | $212,404 | $61,002 | $151,402 |
| 2019 | $2,251 | $208,239 | $59,806 | $148,433 |
| 2018 | $2,219 | $204,156 | $58,633 | $145,523 |
| 2017 | $2,138 | $200,153 | $57,483 | $142,670 |
| 2016 | $2,052 | $196,229 | $56,356 | $139,873 |
| 2015 | $2,037 | $193,281 | $55,509 | $137,772 |
| 2014 | $1,609 | $155,496 | $54,422 | $101,074 |
Map
- 558 E Bonnie Brae Ct
- 652 E Yale St
- 634 E Bonnie Brae Ct
- 713 E Yale St
- 1334 N Sultana Ave
- 665 E Harvard Place
- 1106 N Sultana Ave
- 616 E 6th St
- 306 E Hawthorne St
- 709 E J St
- 649 Plaza Serena
- 760 E J St
- 1339 N Euclid Ave
- 656 E I St
- 839 Richland St
- 945 E 5th St
- 430 E I St
- 845 Plaza Serena
- 838 Sycamore Ct
- 741 E Granada Ct
Ask me questions while you tour the home.