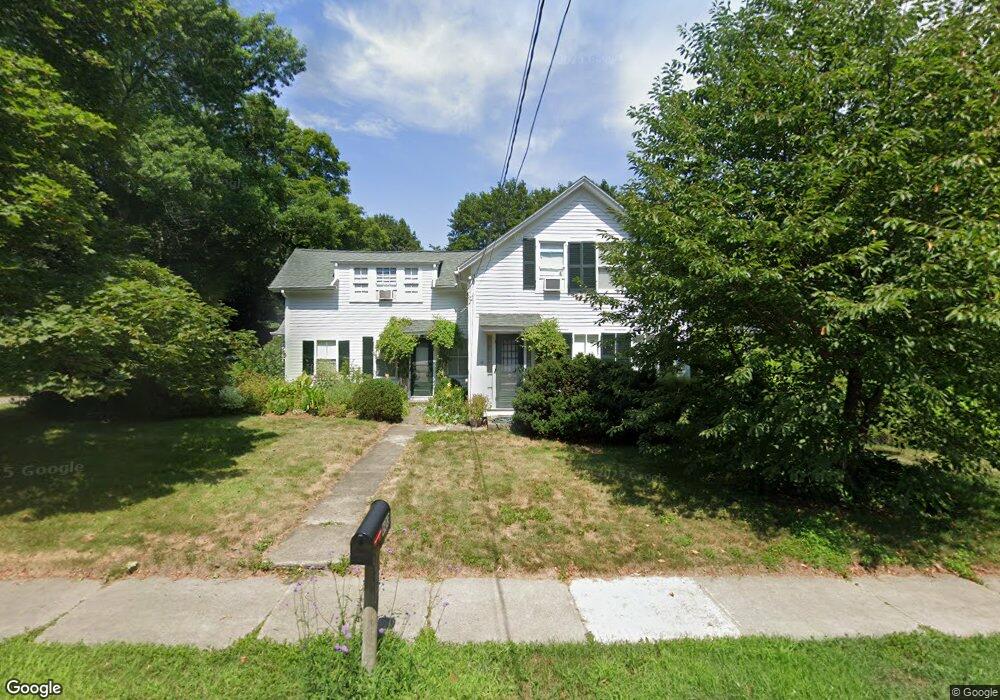
603 East St Walpole, MA 02081
Estimated Value: $704,000 - $772,000
4
Beds
3
Baths
1,836
Sq Ft
$404/Sq Ft
Est. Value
About This Home
This home is located at 603 East St, Walpole, MA 02081 and is currently estimated at $741,514, approximately $403 per square foot. 603 East St is a home located in Norfolk County with nearby schools including Old Post Road School, Walpole Middle School, and Walpole High School.
Ownership History
Date
Name
Owned For
Owner Type
Purchase Details
Closed on
Jul 29, 1993
Sold by
Est Sanford Clarissa H and Sanford Philip H
Bought by
Urban Michael A
Current Estimated Value
Home Financials for this Owner
Home Financials are based on the most recent Mortgage that was taken out on this home.
Original Mortgage
$144,000
Interest Rate
7.32%
Mortgage Type
Purchase Money Mortgage
Create a Home Valuation Report for This Property
The Home Valuation Report is an in-depth analysis detailing your home's value as well as a comparison with similar homes in the area
Home Values in the Area
Average Home Value in this Area
Purchase History
| Date | Buyer | Sale Price | Title Company |
|---|---|---|---|
| Urban Michael A | $180,000 | -- |
Source: Public Records
Mortgage History
| Date | Status | Borrower | Loan Amount |
|---|---|---|---|
| Open | Urban Michael A | $42,000 | |
| Closed | Urban Michael A | $200,000 | |
| Closed | Urban Michael A | $144,000 |
Source: Public Records
Tax History Compared to Growth
Tax History
| Year | Tax Paid | Tax Assessment Tax Assessment Total Assessment is a certain percentage of the fair market value that is determined by local assessors to be the total taxable value of land and additions on the property. | Land | Improvement |
|---|---|---|---|---|
| 2025 | $8,084 | $630,100 | $308,900 | $321,200 |
| 2024 | $7,841 | $593,100 | $297,200 | $295,900 |
| 2023 | $7,581 | $545,800 | $258,300 | $287,500 |
| 2022 | $7,122 | $492,500 | $239,000 | $253,500 |
| 2021 | $6,774 | $456,500 | $225,400 | $231,100 |
| 2020 | $6,720 | $448,300 | $212,800 | $235,500 |
| 2019 | $6,422 | $425,300 | $205,400 | $219,900 |
| 2018 | $6,082 | $398,300 | $195,800 | $202,500 |
| 2017 | $5,884 | $383,800 | $188,400 | $195,400 |
| 2016 | $5,569 | $357,900 | $183,200 | $174,700 |
| 2015 | $5,377 | $342,500 | $175,700 | $166,800 |
| 2014 | $5,188 | $329,200 | $175,700 | $153,500 |
Source: Public Records
Map
Nearby Homes
- 4403 Pennington Dr Unit 4403
- 2 Alexandra Way
- 2213 Pennington Dr Unit 2213
- 8 Rainbow Pond Dr Unit 8
- 52 Baker St
- 486 Washington St
- 305 Centre Ln
- 103 Centre Ln
- 634 Main St Unit 14
- 21 Spear Ave
- 224 School St Unit 10
- 291 Plimpton St
- 363 - 367 Washington St
- 66 Gould St
- 7 Washington Green
- 1 Palace Ct
- 22 Coolidge Rd
- 270 Moosehill Rd
- 1156 Washington St
- 145 South St Unit 5