Estimated Value: $376,000 - $411,000
4
Beds
3
Baths
2,462
Sq Ft
$160/Sq Ft
Est. Value
About This Home
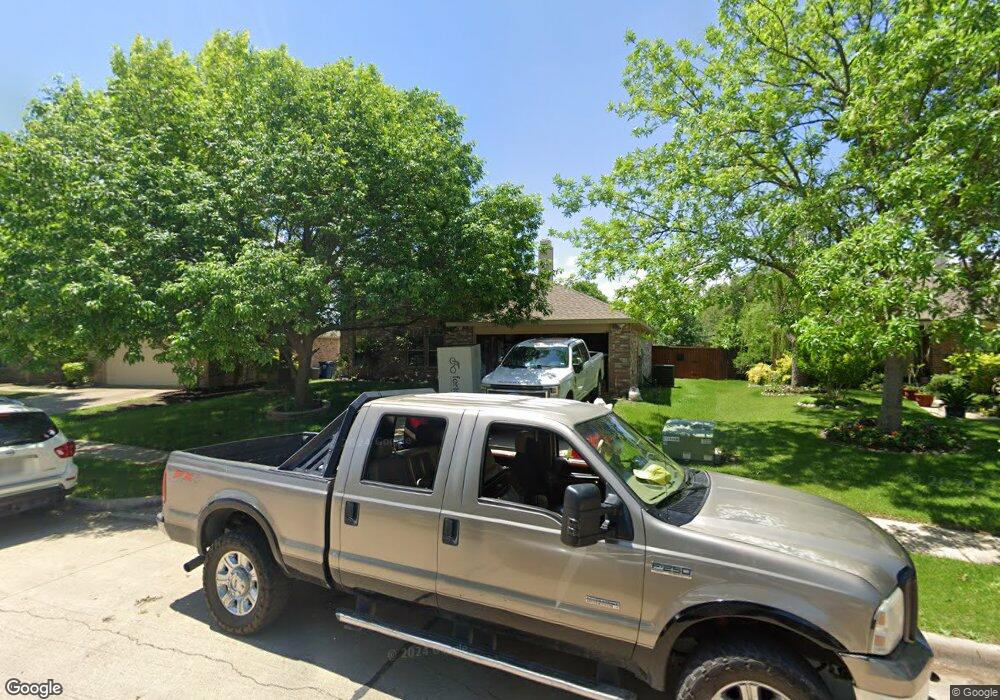
This home is located at 603 Gunters Mountain Ln, Wylie, TX 75098 and is currently estimated at $394,029, approximately $160 per square foot. 603 Gunters Mountain Ln is a home located in Collin County with nearby schools including Dodd Elementary School, Frank Mcmillan Junior High School, and Davis Intermediate School.
Ownership History
Date
Name
Owned For
Owner Type
Purchase Details
Closed on
Sep 28, 2016
Sold by
Trevizo Manuel and Trevizo Maria L
Bought by
Trevizo Ivette
Current Estimated Value
Home Financials for this Owner
Home Financials are based on the most recent Mortgage that was taken out on this home.
Original Mortgage
$75,000
Outstanding Balance
$35,153
Interest Rate
3.46%
Estimated Equity
$358,876
Purchase Details
Closed on
Oct 26, 2010
Sold by
Bernard Sommer and Bernard Robert
Bought by
Trevizo Manuel
Home Financials for this Owner
Home Financials are based on the most recent Mortgage that was taken out on this home.
Original Mortgage
$115,600
Interest Rate
4.41%
Purchase Details
Closed on
Nov 12, 2002
Sold by
Centex Homes
Bought by
Williamson Sonner
Home Financials for this Owner
Home Financials are based on the most recent Mortgage that was taken out on this home.
Original Mortgage
$149,731
Interest Rate
6%
Create a Home Valuation Report for This Property
The Home Valuation Report is an in-depth analysis detailing your home's value as well as a comparison with similar homes in the area
Home Values in the Area
Average Home Value in this Area
Purchase History
| Date | Buyer | Sale Price | Title Company |
|---|---|---|---|
| Trevizo Ivette | -- | Fatco | |
| Trevizo Manuel | -- | None Available | |
| Williamson Sonner | -- | -- |
Source: Public Records
Mortgage History
| Date | Status | Borrower | Loan Amount |
|---|---|---|---|
| Open | Trevizo Ivette | $75,000 | |
| Closed | Trevizo Manuel | $115,600 | |
| Previous Owner | Williamson Sonner | $149,731 |
Source: Public Records
Tax History Compared to Growth
Tax History
| Year | Tax Paid | Tax Assessment Tax Assessment Total Assessment is a certain percentage of the fair market value that is determined by local assessors to be the total taxable value of land and additions on the property. | Land | Improvement |
|---|---|---|---|---|
| 2025 | $5,812 | $396,435 | $99,750 | $321,931 |
| 2024 | $5,812 | $360,395 | $99,750 | $303,048 |
| 2023 | $5,812 | $327,632 | $84,000 | $292,781 |
| 2022 | $6,534 | $297,847 | $84,000 | $253,164 |
| 2021 | $6,371 | $270,770 | $68,250 | $202,520 |
| 2020 | $6,209 | $250,053 | $57,750 | $192,303 |
| 2019 | $6,794 | $258,532 | $57,750 | $200,782 |
| 2018 | $6,743 | $250,389 | $57,750 | $192,639 |
| 2017 | $6,474 | $240,394 | $52,500 | $187,894 |
| 2016 | $5,145 | $207,416 | $42,000 | $165,416 |
| 2015 | $3,269 | $168,349 | $36,750 | $131,599 |
Source: Public Records
Map
Nearby Homes
- 902 Greene Way
- 908 Greene Way
- 1003 Ann Dr
- 907 Carlton Rd
- 626 Gunters Mountain Ln
- 913 Chickesaw Ln
- 1426 Mars Lander Ln
- 1428 Mars Lander Ln
- 1422 Mars Lander Ln
- 1430 Mars Lander Ln
- Crest Plan at The Apollo
- Nova Plan at The Apollo
- Solis Plan at The Apollo
- 1432 Mars Lander Ln
- 1434 Mars Lander Ln
- 705 Baldwin Rd
- 410 Oxford Dr
- 713 Kinston Ct
- 1306 Ardmore Way
- 605 Graham Ct
- 605 Gunters Mountain Ln
- 601 Gunters Mountain Ln
- 1002 Lowndes Ln
- 1000 Lowndes Ln
- 607 Gunters Mountain Ln
- 1004 Lowndes Ln
- 600 Hanceville Way
- 609 Gunters Mountain Ln
- 602 Gunters Mountain Ln
- 600 Gunters Mountain Ln
- 1006 Lowndes Ln
- 905 Ann Dr
- 903 Ann Dr
- 604 Gunters Mountain Ln
- 901 Sanden Blvd
- 907 Ann Dr
- 611 Gunters Mountain Ln
- 901 Ann Dr
- 602 Hanceville Way
- 909 Ann Dr