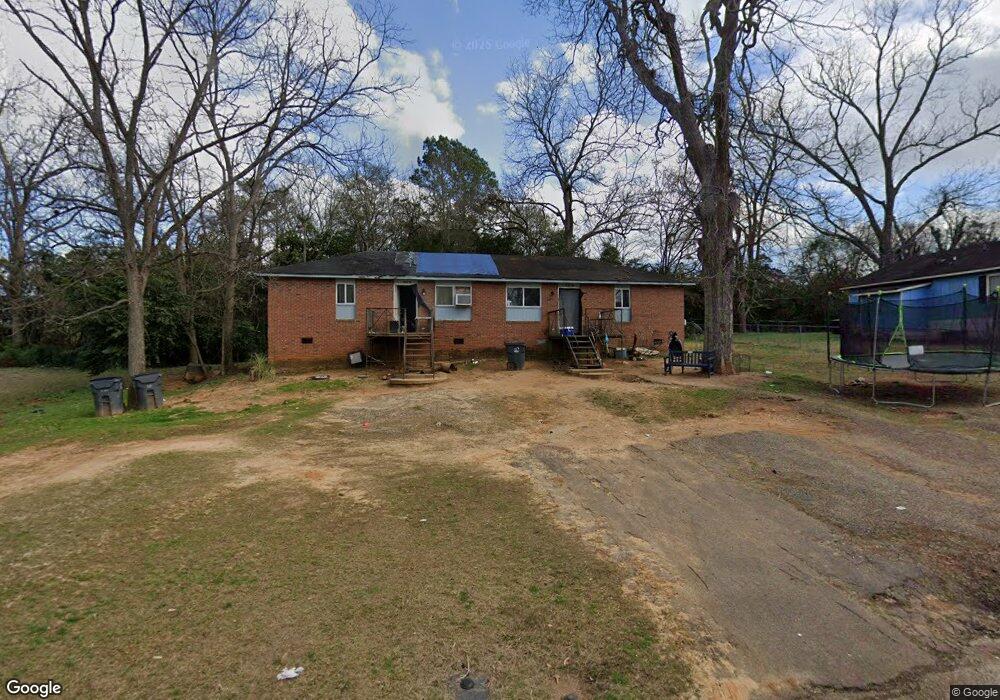
603 Lowe St Unit AB Americus, GA 31709
Estimated Value: $71,667 - $105,000
4
Beds
2
Baths
1,440
Sq Ft
$60/Sq Ft
Est. Value
About This Home
This home is located at 603 Lowe St Unit AB, Americus, GA 31709 and is currently estimated at $85,917, approximately $59 per square foot. 603 Lowe St Unit AB is a home located in Sumter County with nearby schools including Sumter County Primary School, Sumter County Elementary School, and Sumter County Middle School.
Ownership History
Date
Name
Owned For
Owner Type
Purchase Details
Closed on
Jun 14, 2021
Sold by
Hull Rebecca O
Bought by
Barner Rodriquez Kentrell
Current Estimated Value
Home Financials for this Owner
Home Financials are based on the most recent Mortgage that was taken out on this home.
Original Mortgage
$48,436
Interest Rate
2.9%
Mortgage Type
New Conventional
Purchase Details
Closed on
Dec 19, 2007
Sold by
V J Wanner Llc
Bought by
Hull Rebecca O
Purchase Details
Closed on
Oct 1, 2003
Sold by
Hall George W and Hall Sus
Bought by
V J Wanner Llc
Purchase Details
Closed on
Nov 30, 1992
Sold by
Davis Dennis R
Bought by
Hall George W
Purchase Details
Closed on
Apr 28, 1988
Sold by
Daniel Reginald S
Bought by
Davis Dennis R
Purchase Details
Closed on
Nov 13, 1980
Bought by
Daniel Reginald S
Create a Home Valuation Report for This Property
The Home Valuation Report is an in-depth analysis detailing your home's value as well as a comparison with similar homes in the area
Purchase History
| Date | Buyer | Sale Price | Title Company |
|---|---|---|---|
| Barner Rodriquez Kentrell | $56,000 | -- | |
| Hull Rebecca O | $25,000 | -- | |
| V J Wanner Llc | -- | -- | |
| Hall George W | $29,100 | -- | |
| Davis Dennis R | $37,600 | -- | |
| Daniel Reginald S | -- | -- |
Source: Public Records
Mortgage History
| Date | Status | Borrower | Loan Amount |
|---|---|---|---|
| Closed | Barner Rodriquez Kentrell | $48,436 | |
| Closed | Hull Rebecca O | $0 |
Source: Public Records
Tax History
| Year | Tax Paid | Tax Assessment Tax Assessment Total Assessment is a certain percentage of the fair market value that is determined by local assessors to be the total taxable value of land and additions on the property. | Land | Improvement |
|---|---|---|---|---|
| 2025 | $558 | $12,360 | $1,440 | $10,920 |
| 2024 | $558 | $12,360 | $1,440 | $10,920 |
| 2023 | $545 | $12,360 | $1,440 | $10,920 |
| 2022 | $374 | $12,360 | $1,440 | $10,920 |
| 2021 | $546 | $12,360 | $1,440 | $10,920 |
| 2020 | $661 | $12,360 | $1,440 | $10,920 |
| 2019 | $591 | $12,360 | $1,440 | $10,920 |
| 2018 | $389 | $12,360 | $1,440 | $10,920 |
| 2017 | $389 | $12,360 | $1,440 | $10,920 |
| 2016 | $546 | $12,360 | $1,440 | $10,920 |
| 2015 | $425 | $13,880 | $1,440 | $12,440 |
| 2014 | $426 | $13,880 | $1,440 | $12,440 |
| 2013 | -- | $15,000 | $1,440 | $13,560 |
Source: Public Records
Map
Nearby Homes
- 333 Academy St
- 433 Mayo St
- 621 E Church St
- 211 Horne St
- Lots 5 6 13 14 Hwy 49n
- 305 E Church St
- 604 A-C Ga Hwy 49s
- 253 Ga Hwy 27e
- 909 Hwy E Ga Hwy 27e
- 316 Taylor St
- 1302 Crawford St
- 213 Mitchell St
- 1720 E Lamar St
- 501 Varsity Dr
- 518 E Furlow St
- 620 E Furlow St
- 501 S Lee St
- 522 S Lee St
- 423 E Hill St
- 406 S Hampton St
- 603 A-B Lowe St Unit 1
- 605 Lowe St
- 402 Academy St
- 346 Academy St
- 603 Ashby St
- 406 Academy St Unit AB
- 601 Ashby St
- 606 Lowe St Unit AB
- 605 Ashby St
- 401 Academy St Unit AB
- 533 Ashby St Unit AB
- 403 Academy St Unit AB
- 404 Pine St
- 406 Pine St
- 340 Academy St
- 408 Academy St
- 343 Academy St
- 405 Academy St
- 531 Ashby St
- 408 Pine St
Your Personal Tour Guide
Ask me questions while you tour the home.