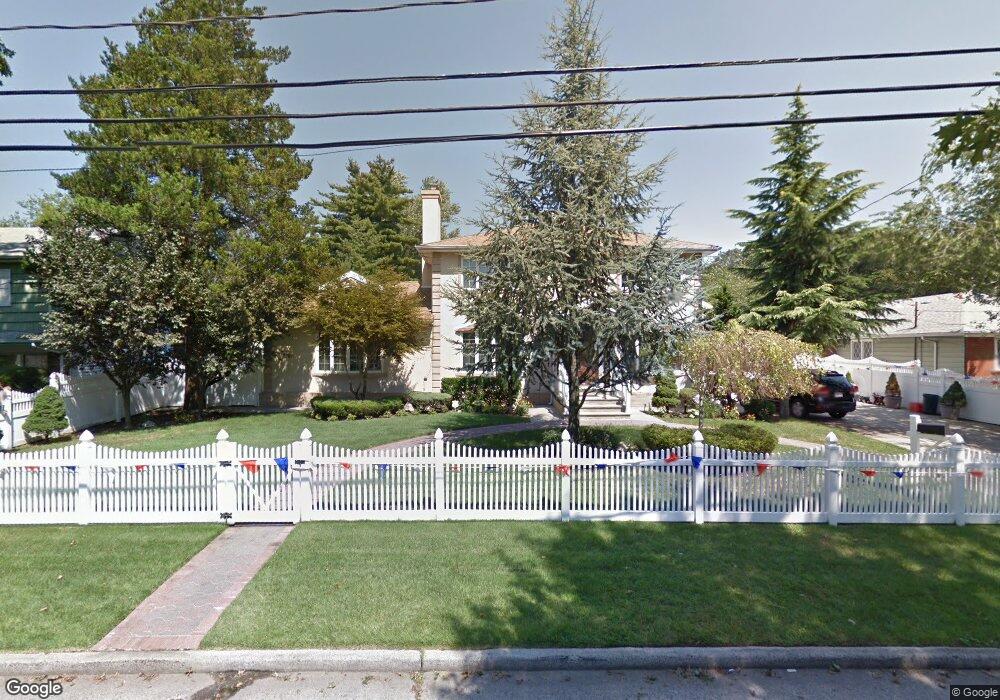
603 Maple St West Hempstead, NY 11552
Estimated Value: $985,000 - $1,183,388
Studio
4
Baths
2,674
Sq Ft
$405/Sq Ft
Est. Value
About This Home
This home is located at 603 Maple St, West Hempstead, NY 11552 and is currently estimated at $1,084,194, approximately $405 per square foot. 603 Maple St is a home located in Nassau County with nearby schools including Chestnut Street School, West Hempstead Middle School, and West Hempstead Secondary School.
Ownership History
Date
Name
Owned For
Owner Type
Purchase Details
Closed on
Dec 28, 1998
Sold by
Rothenbucher Roland R
Bought by
Singh Prit M and Kaur Harbans
Current Estimated Value
Home Financials for this Owner
Home Financials are based on the most recent Mortgage that was taken out on this home.
Original Mortgage
$100,000
Interest Rate
6.67%
Mortgage Type
Purchase Money Mortgage
Purchase Details
Closed on
Jan 24, 1997
Sold by
Maher Ibrahim
Bought by
Panuccio Steve
Create a Home Valuation Report for This Property
The Home Valuation Report is an in-depth analysis detailing your home's value as well as a comparison with similar homes in the area
Home Values in the Area
Average Home Value in this Area
Purchase History
| Date | Buyer | Sale Price | Title Company |
|---|---|---|---|
| Singh Prit M | $182,000 | -- | |
| Singh Prit M | $182,000 | American Title Ins Co | |
| Singh Prit M | $182,000 | American Title Ins Co | |
| Singh Prit M | $182,000 | American Title Ins Co | |
| Singh Prit M | $182,000 | American Title Ins Co | |
| Panuccio Steve | $100,000 | -- | |
| Panuccio Steve | $100,000 | -- |
Source: Public Records
Mortgage History
| Date | Status | Borrower | Loan Amount |
|---|---|---|---|
| Closed | Singh Prit M | $100,000 | |
| Closed | Singh Prit M | $0 |
Source: Public Records
Tax History
| Year | Tax Paid | Tax Assessment Tax Assessment Total Assessment is a certain percentage of the fair market value that is determined by local assessors to be the total taxable value of land and additions on the property. | Land | Improvement |
|---|---|---|---|---|
| 2024 | $5,552 | $746 | $509 | $237 |
Source: Public Records
Map
Nearby Homes
- 618 Jennings Ave
- 629 Park Ave
- 647 Jennings Ave
- 447 Chestnut St
- 369 Woodfield Rd
- 321 Oakford St
- 815 Sunshine Ave
- 55 Melvin Ave
- 846 Harrison St
- 240 Woodfield Rd
- 841 Woodfield Rd
- 853 Arthur St
- 635 Hempstead Ave
- 590 Langley Ave
- 16 Wright Rd
- 218 Colony St
- 837 Cleveland St
- 815 Iris Place
- 523 Cedar St
- 352 Hempstead Ave
Your Personal Tour Guide
Ask me questions while you tour the home.