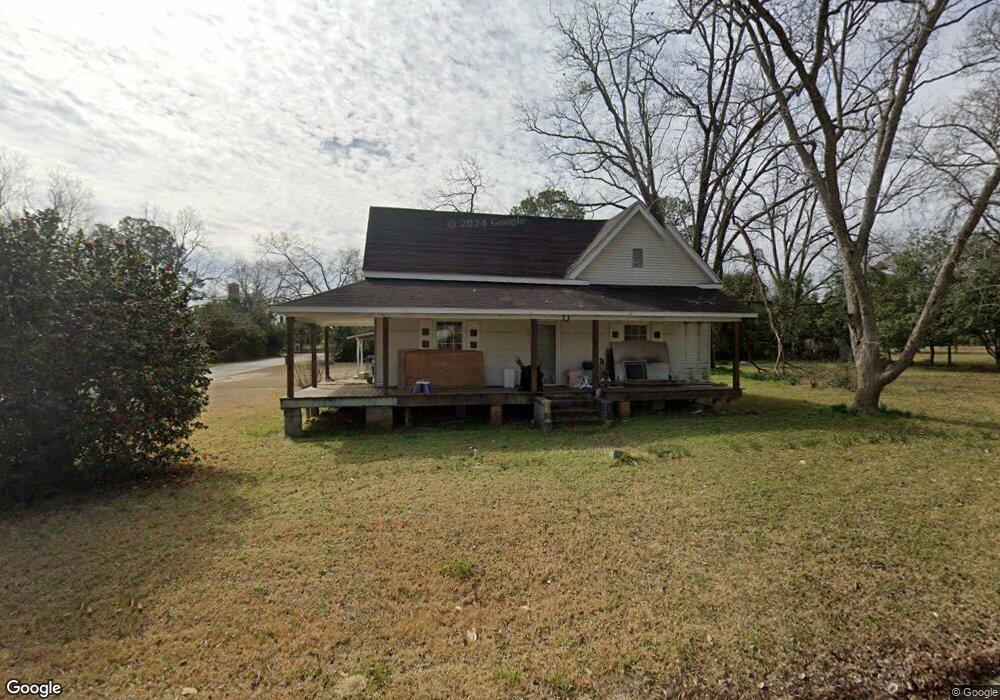
603 Myrtle St Uvalda, GA 30473
Estimated Value: $56,000 - $103,932
Studio
1
Bath
1,541
Sq Ft
$51/Sq Ft
Est. Value
About This Home
This home is located at 603 Myrtle St, Uvalda, GA 30473 and is currently estimated at $79,233, approximately $51 per square foot. 603 Myrtle St is a home located in Montgomery County with nearby schools including Montgomery County Elementary School, Montgomery County Middle School, and Montgomery County High School.
Ownership History
Date
Name
Owned For
Owner Type
Purchase Details
Closed on
Jun 15, 2015
Sold by
Altamaha Bank & Trust Co
Bought by
Robertson Meredith Mendy
Current Estimated Value
Purchase Details
Closed on
May 13, 2015
Sold by
Smith Lewis Richard
Bought by
Altamaha Bank & Trust Co
Purchase Details
Closed on
Mar 28, 2014
Sold by
Dopson Talmadge D
Bought by
Smith Lewis Richard
Purchase Details
Closed on
Aug 3, 2005
Sold by
Dopson Talmadge Dea
Bought by
Dopson Talmadge Dean
Purchase Details
Closed on
Jul 18, 2000
Sold by
Goff Wayne
Bought by
Dopson Talmadge Dea
Purchase Details
Closed on
Feb 23, 2000
Sold by
Goff Sara C
Bought by
Goff Wayne
Purchase Details
Closed on
Dec 30, 1986
Sold by
Craft Craft E and Craft Lamont
Bought by
Goff Sara C
Purchase Details
Closed on
Oct 2, 1986
Sold by
Craft Craft E and Craft J
Bought by
Craft Craft E and Craft Lamont
Purchase Details
Closed on
Jun 2, 1944
Bought by
Craft Craft E and Craft J
Create a Home Valuation Report for This Property
The Home Valuation Report is an in-depth analysis detailing your home's value as well as a comparison with similar homes in the area
Purchase History
| Date | Buyer | Sale Price | Title Company |
|---|---|---|---|
| Robertson Meredith Mendy | $15,000 | -- | |
| Altamaha Bank & Trust Co | -- | -- | |
| Smith Lewis Richard | $25,000 | -- | |
| Dopson Talmadge Dean | -- | -- | |
| Dopson Talmadge Dean | -- | -- | |
| Dopson Talmadge Dea | $25,000 | -- | |
| Goff Wayne | -- | -- | |
| Goff Sara C | $18,500 | -- | |
| Craft Craft E | -- | -- | |
| Craft Craft E | -- | -- |
Source: Public Records
Tax History
| Year | Tax Paid | Tax Assessment Tax Assessment Total Assessment is a certain percentage of the fair market value that is determined by local assessors to be the total taxable value of land and additions on the property. | Land | Improvement |
|---|---|---|---|---|
| 2025 | $604 | $17,372 | $1,546 | $15,826 |
| 2024 | $604 | $17,372 | $1,546 | $15,826 |
| 2023 | $533 | $18,005 | $1,546 | $16,459 |
| 2022 | $538 | $17,991 | $1,546 | $16,445 |
| 2021 | $534 | $17,991 | $1,546 | $16,445 |
| 2020 | $355 | $11,644 | $1,546 | $10,098 |
| 2019 | $348 | $11,644 | $1,546 | $10,098 |
| 2018 | $393 | $12,173 | $1,546 | $10,627 |
| 2017 | $393 | $12,173 | $1,546 | $10,627 |
| 2016 | $167 | $12,173 | $1,546 | $10,627 |
| 2015 | -- | $12,173 | $1,546 | $10,627 |
| 2014 | -- | $12,173 | $1,546 | $10,627 |
Source: Public Records
Map
Nearby Homes
- 00 Georgia 135
- 5223 Georgia 135
- 298 Bud Denton Rd
- 0 Dead River Rd Lots #25 26 27 32 Unit 10742280
- 2421 S Old River Rd
- 129 Cherry St
- 00 Dead River Rd Lots #25 26 27 32
- 5141 Cedar Crossing Rd
- 0 Dead River Rd Unit 22915185
- none Dead River Rd
- 6 Three Rivers Estates Rd
- Oconee River Unit Bells Ferry Highway
- 1102 Three Rivers Ln
- 1102 Three River Ln
- 674 McNatt Falls Rd
- 143 Sadie Galbreath Rd
- 981 Bells Ferry Rd
- 496 Grays Landing Rd
- 0 Gray's Landing Rd Unit 23834
- 0 Gray's Landing Rd Unit 10647341
Your Personal Tour Guide
Ask me questions while you tour the home.