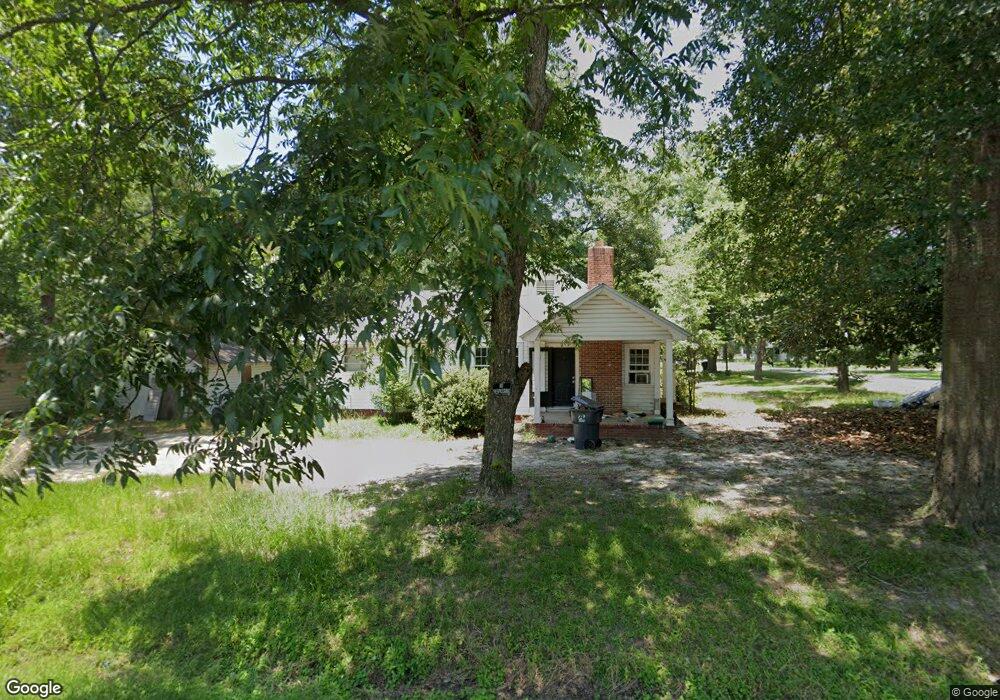
603 N 4th St Cordele, GA 31015
Estimated Value: $50,000 - $93,000
2
Beds
1
Bath
908
Sq Ft
$78/Sq Ft
Est. Value
About This Home
This home is located at 603 N 4th St, Cordele, GA 31015 and is currently estimated at $70,662, approximately $77 per square foot. 603 N 4th St is a home located in Crisp County with nearby schools including Crisp County Elementary School, Crisp County Primary School, and Crisp County Middle School.
Ownership History
Date
Name
Owned For
Owner Type
Purchase Details
Closed on
Feb 8, 2005
Sold by
Spires Danny
Bought by
Spires Wesley D and Spires Denise Tate
Current Estimated Value
Home Financials for this Owner
Home Financials are based on the most recent Mortgage that was taken out on this home.
Original Mortgage
$28,412
Interest Rate
5.68%
Mortgage Type
New Conventional
Purchase Details
Closed on
Aug 6, 1998
Sold by
Mcgee Derrell W
Bought by
Spires Daniel J
Purchase Details
Closed on
Sep 8, 1997
Sold by
Mcgee W H
Bought by
Mcgee Derrell W
Purchase Details
Closed on
Feb 21, 1946
Sold by
Pannell Harrell J
Bought by
Mcgee W H
Create a Home Valuation Report for This Property
The Home Valuation Report is an in-depth analysis detailing your home's value as well as a comparison with similar homes in the area
Purchase History
| Date | Buyer | Sale Price | Title Company |
|---|---|---|---|
| Spires Wesley D | $64,000 | -- | |
| Spires Daniel J | $34,900 | -- | |
| Mcgee Derrell W | -- | -- | |
| Mcgee W H | -- | -- |
Source: Public Records
Mortgage History
| Date | Status | Borrower | Loan Amount |
|---|---|---|---|
| Closed | Spires Wesley D | $28,412 |
Source: Public Records
Tax History
| Year | Tax Paid | Tax Assessment Tax Assessment Total Assessment is a certain percentage of the fair market value that is determined by local assessors to be the total taxable value of land and additions on the property. | Land | Improvement |
|---|---|---|---|---|
| 2025 | $630 | $20,610 | $1,250 | $19,360 |
| 2024 | $524 | $19,071 | $1,250 | $17,821 |
| 2023 | $686 | $18,301 | $1,250 | $17,051 |
| 2022 | $463 | $17,531 | $1,250 | $16,281 |
| 2021 | $454 | $16,761 | $1,250 | $15,511 |
| 2020 | $472 | $16,761 | $1,250 | $15,511 |
| 2019 | $475 | $16,761 | $1,250 | $15,511 |
| 2018 | $344 | $11,685 | $1,500 | $10,185 |
| 2017 | $474 | $11,685 | $1,500 | $10,185 |
| 2016 | $346 | $11,685 | $1,500 | $10,185 |
| 2015 | -- | $11,685 | $1,500 | $10,185 |
| 2014 | -- | $11,685 | $1,500 | $10,185 |
| 2013 | -- | $11,684 | $1,500 | $10,184 |
Source: Public Records
Map
Nearby Homes
Your Personal Tour Guide
Ask me questions while you tour the home.