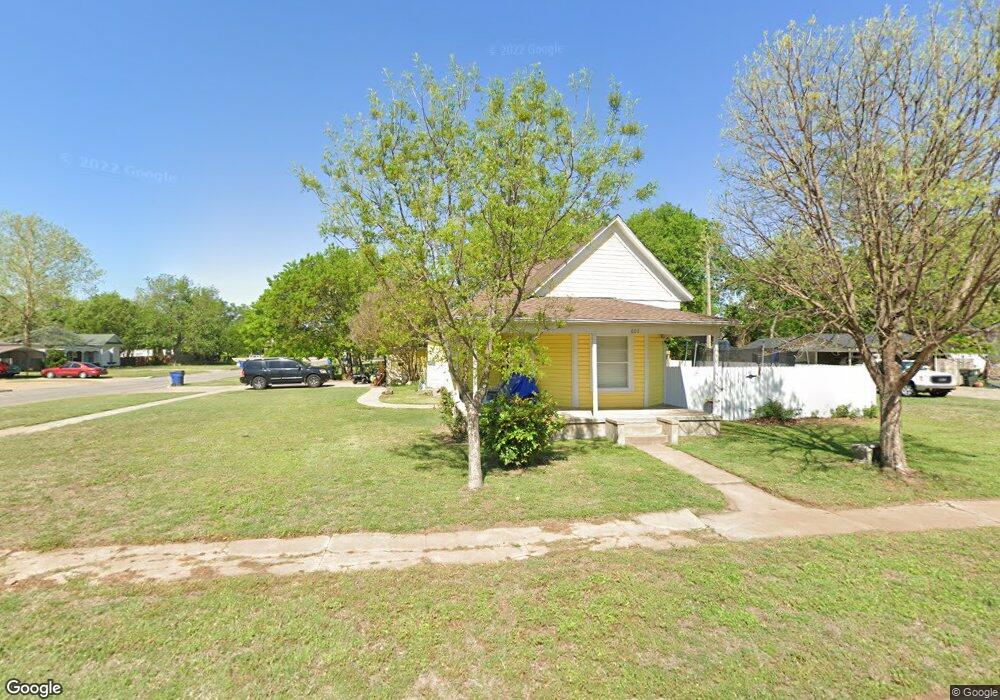
603 N 9th St Duncan, OK 73533
Estimated Value: $104,000 - $119,075
3
Beds
2
Baths
1,386
Sq Ft
$82/Sq Ft
Est. Value
About This Home
This home is located at 603 N 9th St, Duncan, OK 73533 and is currently estimated at $113,019, approximately $81 per square foot. 603 N 9th St is a home located in Stephens County with nearby schools including Emerson Elementary School, Duncan Middle School, and Duncan High School.
Ownership History
Date
Name
Owned For
Owner Type
Purchase Details
Closed on
Nov 9, 2007
Sold by
Halterman John C and Halterman Shirley A
Bought by
Goldstrom John D and Goldstrom Judy Brimer
Current Estimated Value
Home Financials for this Owner
Home Financials are based on the most recent Mortgage that was taken out on this home.
Original Mortgage
$75,900
Outstanding Balance
$47,903
Interest Rate
6.42%
Mortgage Type
VA
Estimated Equity
$65,116
Purchase Details
Closed on
Nov 6, 2007
Sold by
Whitney Terrence M and Whitney Frances A
Bought by
Halterman John C and Halterman Shirley A
Home Financials for this Owner
Home Financials are based on the most recent Mortgage that was taken out on this home.
Original Mortgage
$75,900
Outstanding Balance
$47,903
Interest Rate
6.42%
Mortgage Type
VA
Estimated Equity
$65,116
Purchase Details
Closed on
Mar 28, 1995
Sold by
Pollock Edward Lynn
Purchase Details
Closed on
Mar 27, 1992
Sold by
Masters William L
Create a Home Valuation Report for This Property
The Home Valuation Report is an in-depth analysis detailing your home's value as well as a comparison with similar homes in the area
Home Values in the Area
Average Home Value in this Area
Purchase History
| Date | Buyer | Sale Price | Title Company |
|---|---|---|---|
| Goldstrom John D | $75,900 | Stewart Abstract & Title | |
| Halterman John C | -- | Stewart Abstract & Title | |
| -- | $37,000 | -- | |
| -- | $22,000 | -- |
Source: Public Records
Mortgage History
| Date | Status | Borrower | Loan Amount |
|---|---|---|---|
| Open | Goldstrom John D | $75,900 |
Source: Public Records
Tax History Compared to Growth
Tax History
| Year | Tax Paid | Tax Assessment Tax Assessment Total Assessment is a certain percentage of the fair market value that is determined by local assessors to be the total taxable value of land and additions on the property. | Land | Improvement |
|---|---|---|---|---|
| 2025 | $641 | $7,899 | $579 | $7,320 |
| 2024 | $641 | $7,524 | $579 | $6,945 |
| 2023 | $641 | $7,380 | $579 | $6,801 |
| 2022 | $506 | $7,165 | $579 | $6,586 |
| 2021 | $507 | $6,957 | $579 | $6,378 |
| 2020 | $480 | $6,557 | $579 | $5,978 |
| 2019 | $464 | $6,366 | $579 | $5,787 |
| 2018 | $529 | $6,945 | $579 | $6,366 |
| 2017 | $511 | $6,945 | $579 | $6,366 |
| 2016 | $492 | $6,794 | $576 | $6,218 |
| 2015 | $481 | $6,597 | $563 | $6,034 |
| 2014 | $481 | $6,405 | $550 | $5,855 |
Source: Public Records
Map
Nearby Homes
- 1105 W Beech Ave
- 1116 1116 W Chestnut
- 1213 W Pine Ave
- 810 810 N 12th St
- 1112 W Spruce St
- 805 805 N 5th
- 1001 1001 W Hackberry
- 705 W Hackberry Ave
- 1309 W Beech Ave
- 512 W Oak Ave
- 1203 W Walnut Ave
- 1112 1112 N 12th
- 1105 N Grand Blvd
- 312 W Beech Ave
- 815 N 14th St
- 1114 N 13th St
- 812 N 15th St
- 1444 N 8th St
- 1112 N 5th St
- 1202 N Grand Blvd