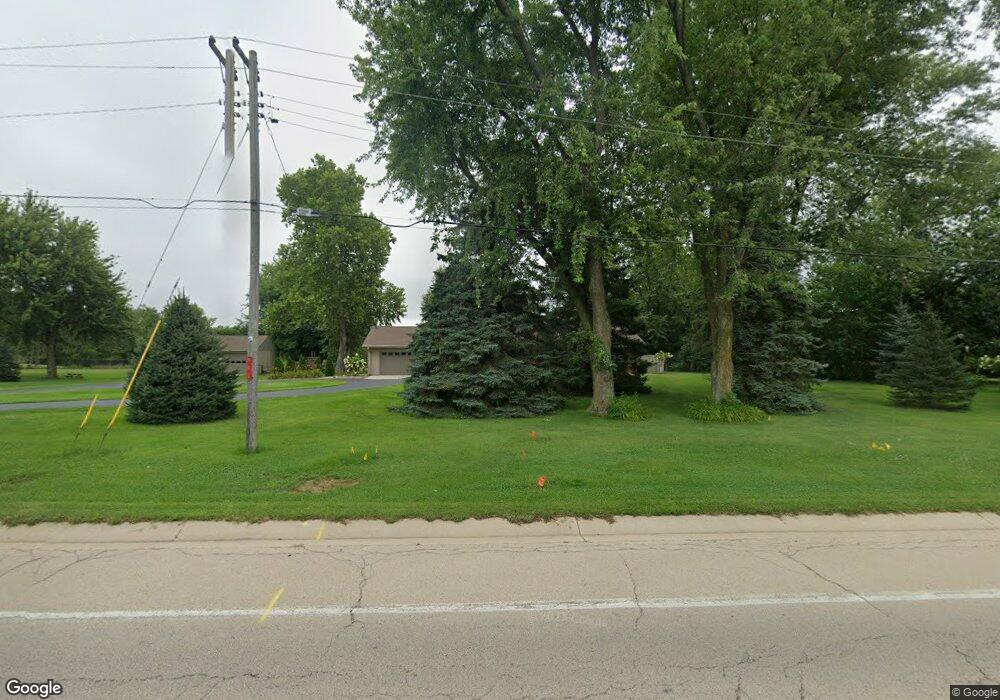
603 N Walnut Ave Forreston, IL 61030
Estimated Value: $187,505 - $214,000
--
Bed
--
Bath
1,558
Sq Ft
$130/Sq Ft
Est. Value
About This Home
This home is located at 603 N Walnut Ave, Forreston, IL 61030 and is currently estimated at $202,626, approximately $130 per square foot. 603 N Walnut Ave is a home located in Ogle County with nearby schools including Forreston High School.
Ownership History
Date
Name
Owned For
Owner Type
Purchase Details
Closed on
Feb 16, 2017
Sold by
Hoffman Daniel and Hoffman Brandi
Bought by
Altensey Gary and Altensey Andrea
Current Estimated Value
Home Financials for this Owner
Home Financials are based on the most recent Mortgage that was taken out on this home.
Original Mortgage
$95,000
Outstanding Balance
$78,479
Interest Rate
4.12%
Mortgage Type
New Conventional
Estimated Equity
$124,147
Purchase Details
Closed on
Aug 1, 2006
Sold by
Simler Lori M
Bought by
Hoffman Daniel and Hoffman Brandi
Home Financials for this Owner
Home Financials are based on the most recent Mortgage that was taken out on this home.
Original Mortgage
$121,250
Interest Rate
6.82%
Mortgage Type
New Conventional
Create a Home Valuation Report for This Property
The Home Valuation Report is an in-depth analysis detailing your home's value as well as a comparison with similar homes in the area
Home Values in the Area
Average Home Value in this Area
Purchase History
| Date | Buyer | Sale Price | Title Company |
|---|---|---|---|
| Altensey Gary | $120,000 | Security First Title | |
| Hoffman Daniel | $121,000 | None Available |
Source: Public Records
Mortgage History
| Date | Status | Borrower | Loan Amount |
|---|---|---|---|
| Open | Altensey Gary | $95,000 | |
| Previous Owner | Hoffman Daniel | $121,250 |
Source: Public Records
Tax History Compared to Growth
Tax History
| Year | Tax Paid | Tax Assessment Tax Assessment Total Assessment is a certain percentage of the fair market value that is determined by local assessors to be the total taxable value of land and additions on the property. | Land | Improvement |
|---|---|---|---|---|
| 2024 | $4,748 | $53,903 | $7,390 | $46,513 |
| 2023 | $4,436 | $50,278 | $6,893 | $43,385 |
| 2022 | $4,207 | $46,004 | $6,307 | $39,697 |
| 2021 | $4,123 | $44,856 | $6,150 | $38,706 |
| 2020 | $4,030 | $44,063 | $6,041 | $38,022 |
| 2019 | $3,949 | $42,267 | $5,795 | $36,472 |
| 2018 | $4,003 | $42,267 | $5,795 | $36,472 |
| 2017 | $4,064 | $42,267 | $5,795 | $36,472 |
| 2016 | $3,618 | $41,265 | $5,658 | $35,607 |
| 2015 | $3,309 | $40,297 | $5,525 | $34,772 |
| 2014 | $3,344 | $40,297 | $5,525 | $34,772 |
| 2013 | $3,442 | $41,301 | $5,663 | $35,638 |
Source: Public Records
Map
Nearby Homes
- 304 Maple Ave
- 406 W Balsam St
- 601 Hewitt St
- 603 Hewitt St
- 603 E Hewitt St
- 613 & 615 Hewitt St
- 617 & 619 Hewitt St
- 609 & 611 Hewitt St
- 605 & 607 Hewitt St
- 702 Hewitt St
- 701 Hewitt St
- 703 Hewitt St
- 706 Hewitt St
- 411 S Walnut Ave
- 404 E Willow St
- 3703 Main St
- 10225 N Brookville Rd
- 31457 Straw School Rd
- 10385 N Rock City Rd
- 5810 W Lightsville Rd
- 601 N Walnut Ave
- 602 N Chestnut St
- 602 N Chestnut Ave
- 101 Magnolia St
- 604 N Walnut Ave
- 98 Magnolia St
- 103 Magnolia St
- 101 Phil Pkwy
- 602 N Walnut Ave
- 100 Magnolia St
- 507 N Walnut Ave
- 102 Magnolia St
- 501 N Ash Ave
- 103 Phil Pkwy
- 107 Magnolia St
- 104 Phil Pkwy
- 508 N Walnut Ave
- 506 N Walnut Ave
- 505 Maple Ave
- 710 N Walnut Ave