Estimated Value: $196,000 - $225,000
3
Beds
2
Baths
2,057
Sq Ft
$102/Sq Ft
Est. Value
About This Home
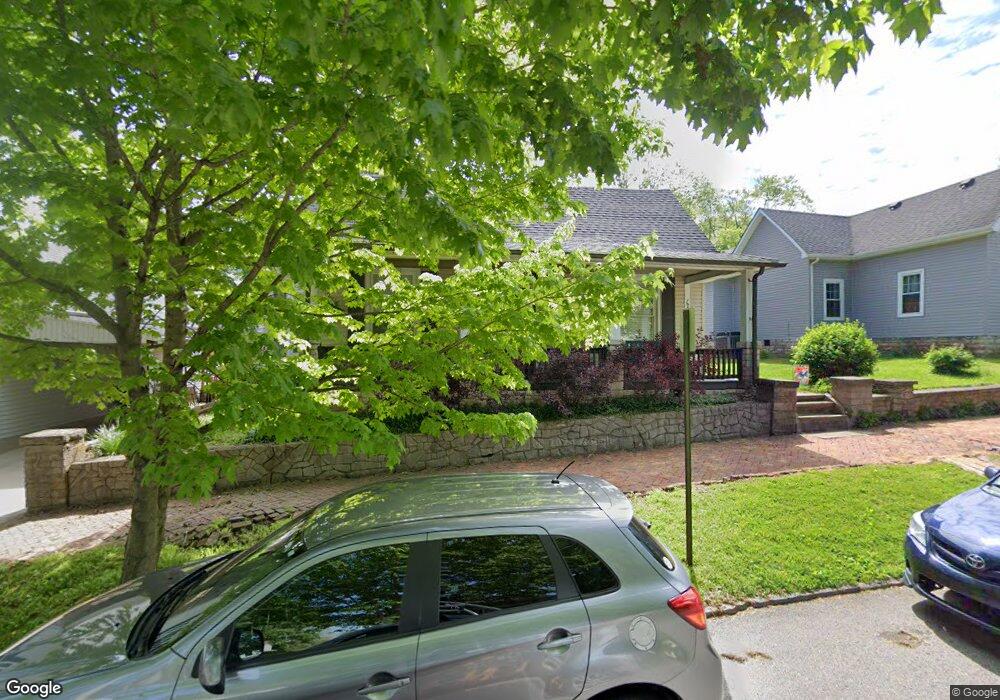
This home is located at 603 N Water St, Salem, IN 47167 and is currently estimated at $209,275, approximately $101 per square foot. 603 N Water St is a home located in Washington County with nearby schools including Bradie M. Shrum Lower Elementary School, Salem Middle School, and Salem High School.
Ownership History
Date
Name
Owned For
Owner Type
Purchase Details
Closed on
May 17, 2023
Sold by
Fox Dakota R
Bought by
Stickler Kyle J
Current Estimated Value
Home Financials for this Owner
Home Financials are based on the most recent Mortgage that was taken out on this home.
Original Mortgage
$190,918
Outstanding Balance
$182,859
Interest Rate
4%
Mortgage Type
New Conventional
Estimated Equity
$26,416
Purchase Details
Closed on
May 14, 2021
Sold by
Davis Gary E
Bought by
Fox Dakota R
Home Financials for this Owner
Home Financials are based on the most recent Mortgage that was taken out on this home.
Original Mortgage
$165,689
Interest Rate
3.1%
Mortgage Type
VA
Purchase Details
Closed on
Jan 12, 2007
Sold by
Christman Antonia L
Bought by
Davis Gary E
Purchase Details
Closed on
Apr 3, 2006
Sold by
U S Bank Na
Bought by
Christman Antonia L
Create a Home Valuation Report for This Property
The Home Valuation Report is an in-depth analysis detailing your home's value as well as a comparison with similar homes in the area
Home Values in the Area
Average Home Value in this Area
Purchase History
| Date | Buyer | Sale Price | Title Company |
|---|---|---|---|
| Stickler Kyle J | $186,900 | None Listed On Document | |
| Fox Dakota R | $175,000 | None Available | |
| Davis Gary E | -- | None Available | |
| Christman Antonia L | -- | None Available |
Source: Public Records
Mortgage History
| Date | Status | Borrower | Loan Amount |
|---|---|---|---|
| Open | Stickler Kyle J | $190,918 | |
| Previous Owner | Fox Dakota R | $165,689 |
Source: Public Records
Tax History Compared to Growth
Tax History
| Year | Tax Paid | Tax Assessment Tax Assessment Total Assessment is a certain percentage of the fair market value that is determined by local assessors to be the total taxable value of land and additions on the property. | Land | Improvement |
|---|---|---|---|---|
| 2024 | $1,204 | $120,400 | $13,100 | $107,300 |
| 2023 | $1,113 | $111,300 | $13,400 | $97,900 |
| 2022 | $1,003 | $100,300 | $13,400 | $86,900 |
| 2021 | $548 | $54,800 | $13,400 | $41,400 |
| 2020 | $530 | $53,000 | $13,400 | $39,600 |
| 2019 | $517 | $51,700 | $13,400 | $38,300 |
| 2018 | $490 | $49,000 | $13,400 | $35,600 |
| 2017 | $419 | $50,400 | $13,400 | $37,000 |
| 2016 | $338 | $48,000 | $13,400 | $34,600 |
| 2014 | $302 | $47,000 | $12,500 | $34,500 |
| 2013 | $412 | $45,900 | $13,400 | $32,500 |
Source: Public Records
Map
Nearby Homes
- 801 N College Ave
- 800 Hayes Ave
- 406 W Mulberry St
- 303 W Market St
- 115 Nichols Ave
- 808 Locust St
- 404 E Mulberry St
- 501 E Homer St
- (Tract 2) 5484 State Road 135
- 52 Public Square
- 905 Locust St
- 301 E Market St
- 207 Southern Ave
- 0 W Mulberry St
- 205 S Harrison St
- 213 Washington Blvd
- 101, 103, & 105 Hounds Way
- 104 Hounds Way
- 1106 W Walnut St
- 805 Smith St