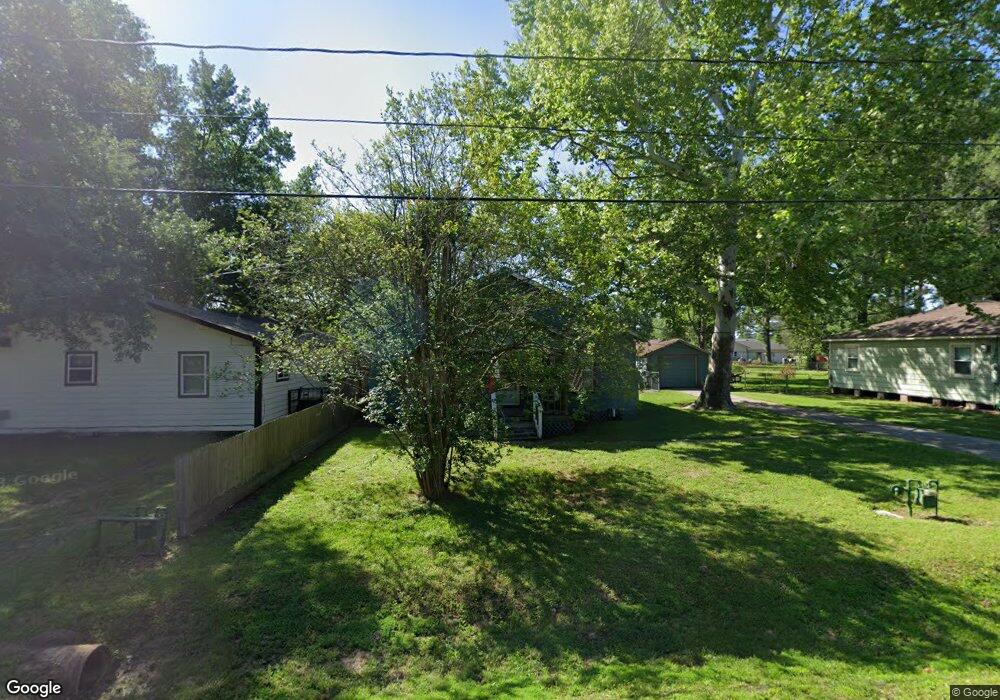
603 Percival St Tomball, TX 77375
Estimated Value: $223,000 - $298,000
2
Beds
2
Baths
1,088
Sq Ft
$242/Sq Ft
Est. Value
About This Home
This home is located at 603 Percival St, Tomball, TX 77375 and is currently estimated at $263,071, approximately $241 per square foot. 603 Percival St is a home located in Harris County with nearby schools including Tomball Elementary School, Tomball Intermediate School, and Tomball Junior High School.
Ownership History
Date
Name
Owned For
Owner Type
Purchase Details
Closed on
Dec 8, 2009
Sold by
Brown Patricia L
Bought by
Nichols Walter B and Nichols Ann E
Current Estimated Value
Home Financials for this Owner
Home Financials are based on the most recent Mortgage that was taken out on this home.
Original Mortgage
$64,000
Outstanding Balance
$42,086
Interest Rate
5.06%
Mortgage Type
New Conventional
Estimated Equity
$220,985
Purchase Details
Closed on
May 15, 2001
Sold by
Ward Elizabeth
Bought by
Brown Patricia L
Home Financials for this Owner
Home Financials are based on the most recent Mortgage that was taken out on this home.
Original Mortgage
$49,500
Interest Rate
6.99%
Purchase Details
Closed on
Dec 31, 1996
Sold by
Ward Elizabeth Ann and Ward Elizabeth Anna M
Bought by
Davis Lynda Jo Corn
Create a Home Valuation Report for This Property
The Home Valuation Report is an in-depth analysis detailing your home's value as well as a comparison with similar homes in the area
Home Values in the Area
Average Home Value in this Area
Purchase History
| Date | Buyer | Sale Price | Title Company |
|---|---|---|---|
| Nichols Walter B | -- | Stewart Title Houston Div | |
| Brown Patricia L | -- | Stewart Title | |
| Davis Lynda Jo Corn | -- | -- | |
| Davis Lynda Jo Corn | -- | -- |
Source: Public Records
Mortgage History
| Date | Status | Borrower | Loan Amount |
|---|---|---|---|
| Open | Nichols Walter B | $64,000 | |
| Previous Owner | Brown Patricia L | $49,500 |
Source: Public Records
Tax History Compared to Growth
Tax History
| Year | Tax Paid | Tax Assessment Tax Assessment Total Assessment is a certain percentage of the fair market value that is determined by local assessors to be the total taxable value of land and additions on the property. | Land | Improvement |
|---|---|---|---|---|
| 2025 | $1,848 | $210,077 | $105,000 | $105,077 |
| 2024 | $1,848 | $205,027 | $98,000 | $107,027 |
| 2023 | $1,848 | $191,027 | $84,000 | $107,027 |
| 2022 | $2,603 | $154,526 | $63,000 | $91,526 |
| 2021 | $2,490 | $119,214 | $45,500 | $73,714 |
| 2020 | $2,341 | $113,148 | $35,000 | $78,148 |
| 2019 | $2,189 | $86,769 | $28,000 | $58,769 |
| 2018 | $921 | $93,727 | $28,000 | $65,727 |
| 2017 | $2,300 | $91,268 | $28,000 | $63,268 |
| 2016 | $2,151 | $85,372 | $28,000 | $57,372 |
| 2015 | $1,579 | $83,021 | $28,000 | $55,021 |
| 2014 | $1,579 | $77,138 | $28,000 | $49,138 |
Source: Public Records
Map
Nearby Homes
- 504 Percival St Unit A
- 505 Percival St
- 516 Clayton St
- TBD Clayton St
- 20734 Open Range Ct
- 18818 Cornelia Fields Ln
- 18723 Buttercup Farms Ln
- 20718 Open Range Ct
- 19951 Epona Creek Dr
- 19935 Epona Creek Dr
- 18707 Buttercup Farms Ln
- 18826 Cornelia Fields Ln
- 20714 Open Range Ct
- 204 Vernon St
- 200 S Vernon St
- 109 Mcphail St
- 0 N Sycamore St
- 1014 Graham Dr Unit A3
- 16623 Farm To Market 2920
- 0 Fm-2920
- 402 S Magnolia St
- 611 Percival St
- 607 Percival St
- 600 Clayton St
- 602 Clayton St
- 509 Percival St
- 604 Clayton St
- 606 Percival St
- 600 Percival St
- 625 Percival St
- 520 Clayton St
- 610 Percival St
- 614 Percival St
- 518 Clayton St
- 309 S Magnolia St
- 303 S Magnolia St
- 510 Percival St
- 631 Percival St
- 507 Percival St
- Lt39,40 Clayton St