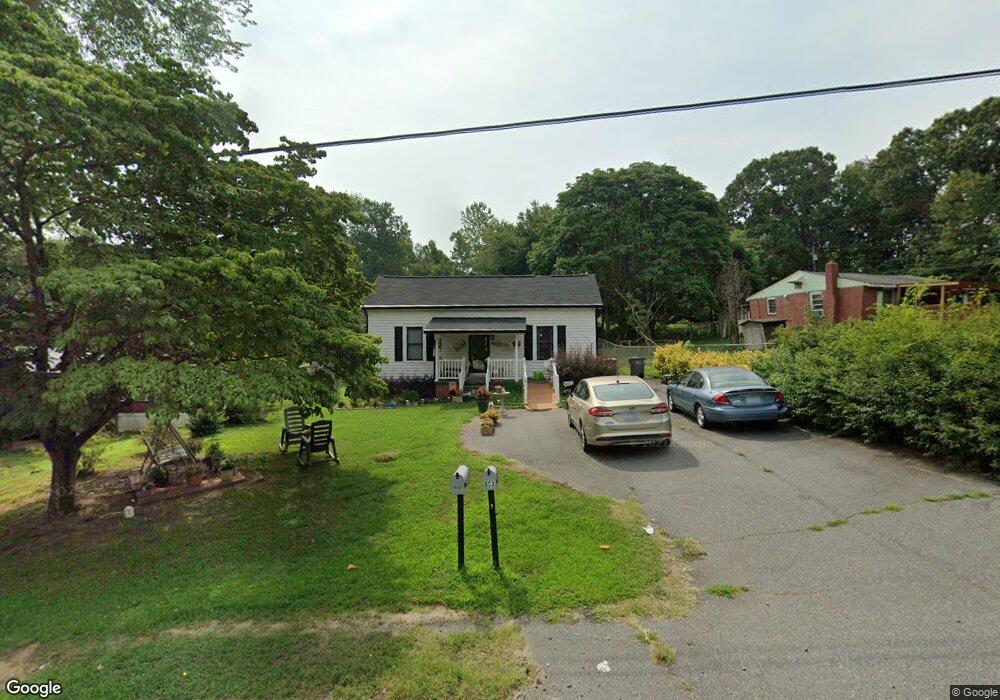
603 Pleasant Ave Kannapolis, NC 28081
Estimated Value: $240,000 - $260,000
3
Beds
2
Baths
1,510
Sq Ft
$166/Sq Ft
Est. Value
About This Home
This home is located at 603 Pleasant Ave, Kannapolis, NC 28081 and is currently estimated at $251,291, approximately $166 per square foot. 603 Pleasant Ave is a home located in Cabarrus County with nearby schools including Fred L. Wilson Elementary School, Kannapolis Middle, and A.L. Brown High School.
Ownership History
Date
Name
Owned For
Owner Type
Purchase Details
Closed on
Jun 10, 2021
Sold by
Jones Joann Wagner and Jones Josephine Roten
Bought by
Jones Joann Wagner
Current Estimated Value
Home Financials for this Owner
Home Financials are based on the most recent Mortgage that was taken out on this home.
Original Mortgage
$104,000
Outstanding Balance
$94,159
Interest Rate
2.9%
Mortgage Type
New Conventional
Estimated Equity
$157,132
Purchase Details
Closed on
May 5, 2011
Sold by
Jones Joann Wagner and Wagner Josephine Roten
Bought by
Jones Joann Wagner and Wagner Josephine Roten
Home Financials for this Owner
Home Financials are based on the most recent Mortgage that was taken out on this home.
Original Mortgage
$85,200
Interest Rate
4.12%
Mortgage Type
New Conventional
Create a Home Valuation Report for This Property
The Home Valuation Report is an in-depth analysis detailing your home's value as well as a comparison with similar homes in the area
Home Values in the Area
Average Home Value in this Area
Purchase History
| Date | Buyer | Sale Price | Title Company |
|---|---|---|---|
| Jones Joann Wagner | -- | None Available | |
| Wagner Jones Joann | -- | New Title Company Name | |
| Jones Joann Wagner | -- | None Available |
Source: Public Records
Mortgage History
| Date | Status | Borrower | Loan Amount |
|---|---|---|---|
| Open | Wagner Jones Joann | $104,000 | |
| Closed | Jones Joann Wagner | $104,000 | |
| Previous Owner | Jones Joann Wagner | $85,200 |
Source: Public Records
Tax History Compared to Growth
Tax History
| Year | Tax Paid | Tax Assessment Tax Assessment Total Assessment is a certain percentage of the fair market value that is determined by local assessors to be the total taxable value of land and additions on the property. | Land | Improvement |
|---|---|---|---|---|
| 2025 | $1,229 | $216,540 | $60,000 | $156,540 |
| 2024 | $1,229 | $216,540 | $60,000 | $156,540 |
| 2023 | $817 | $119,280 | $24,000 | $95,280 |
| 2022 | $786 | $117,100 | $24,000 | $93,100 |
| 2021 | $802 | $117,100 | $24,000 | $93,100 |
| 2020 | $802 | $117,100 | $24,000 | $93,100 |
| 2019 | $665 | $97,020 | $16,800 | $80,220 |
| 2018 | $655 | $97,020 | $16,800 | $80,220 |
| 2017 | $645 | $97,020 | $16,800 | $80,220 |
| 2016 | $1,290 | $94,190 | $18,000 | $76,190 |
| 2015 | $594 | $94,190 | $18,000 | $76,190 |
| 2014 | $594 | $94,190 | $18,000 | $76,190 |
Source: Public Records
Map
Nearby Homes
- 621 Pleasant Ave
- 510 Pleasant Ave
- Lot 1 Pleasant Ave
- 709 Robin Ave
- 1220 Lombardi St
- 0000 Bethpage Rd
- 825 Margate Ave
- 807 Klondale Ave
- Pine Plan at Cherry Grove Townhomes
- Juniper Plan at Cherry Grove Townhomes
- Pine End Home Plan at Cherry Grove Townhomes
- 5782 Knox Ln
- 5772 Knox Ln
- 5772 Knox Ln Unit B
- 1302 & 1304 Mason St
- 5752 Knox Ln
- 5742 Knox Ln
- 562 Westover Ave
- 427 Pleasant Ave
- 5722 Knox Ln
- 601 Pleasant Ave
- 611 Pleasant Ave
- 1110 Boyd St Unit 908
- 911 Boyd St
- 600 Pleasant Ave
- 604 Pleasant Ave
- 1202 Clifton St
- 585 Pleasant Ave
- 1114 Boyd St
- 1204 Clifton St
- 612 Pleasant Ave
- 581 Pleasant Ave
- 910 Rochelle St
- 616 Pleasant Ave
- 1207 Clifton St
- 1207 Clifton St
- 710 Robin Ave
- 710 Robin Ave
- 1206 Clifton St
- 620 Pleasant Ave