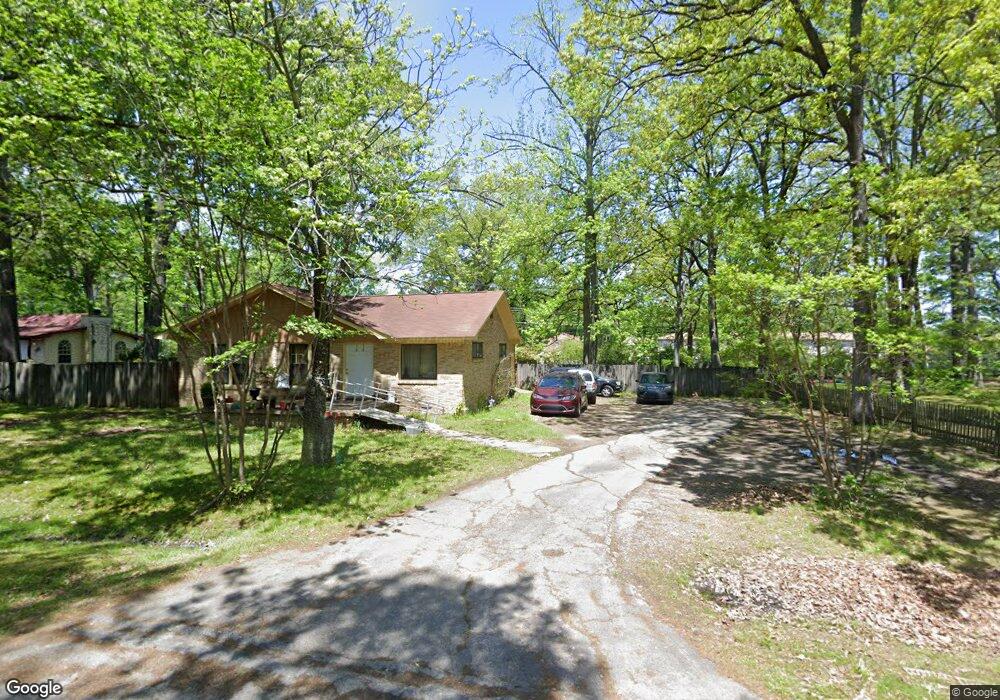
603 Ridgelea Ave Sherwood, AR 72120
Estimated Value: $119,000 - $150,000
--
Bed
2
Baths
1,349
Sq Ft
$101/Sq Ft
Est. Value
About This Home
This home is located at 603 Ridgelea Ave, Sherwood, AR 72120 and is currently estimated at $136,581, approximately $101 per square foot. 603 Ridgelea Ave is a home located in Pulaski County with nearby schools including Oakbrooke Elementary School, Sylvan Hills Middle School, and Sylvan Hills High School.
Ownership History
Date
Name
Owned For
Owner Type
Purchase Details
Closed on
Dec 3, 2020
Sold by
Bailey Homer Doyle
Bought by
Lubiani Chris A and Lubiani Angela C
Current Estimated Value
Home Financials for this Owner
Home Financials are based on the most recent Mortgage that was taken out on this home.
Original Mortgage
$8,000
Interest Rate
2.8%
Mortgage Type
Seller Take Back
Purchase Details
Closed on
Dec 2, 2020
Sold by
Bailey Homer Doyle
Bought by
Lubiani Chris A and Lubiani Angela C
Home Financials for this Owner
Home Financials are based on the most recent Mortgage that was taken out on this home.
Original Mortgage
$8,000
Interest Rate
2.8%
Mortgage Type
Seller Take Back
Purchase Details
Closed on
Mar 28, 2000
Sold by
First American Bank Texas
Bought by
Bailey Homer Doyle
Home Financials for this Owner
Home Financials are based on the most recent Mortgage that was taken out on this home.
Original Mortgage
$45,000
Interest Rate
8.37%
Create a Home Valuation Report for This Property
The Home Valuation Report is an in-depth analysis detailing your home's value as well as a comparison with similar homes in the area
Home Values in the Area
Average Home Value in this Area
Purchase History
| Date | Buyer | Sale Price | Title Company |
|---|---|---|---|
| Lubiani Chris A | $80,000 | United American Title Agency | |
| Lubiani Chris A | $80,000 | Title365 | |
| Bailey Homer Doyle | $50,000 | Stewart Title |
Source: Public Records
Mortgage History
| Date | Status | Borrower | Loan Amount |
|---|---|---|---|
| Closed | Lubiani Chris A | $8,000 | |
| Closed | Lubiani Chris A | $80,000 | |
| Previous Owner | Bailey Homer Doyle | $45,000 |
Source: Public Records
Tax History Compared to Growth
Tax History
| Year | Tax Paid | Tax Assessment Tax Assessment Total Assessment is a certain percentage of the fair market value that is determined by local assessors to be the total taxable value of land and additions on the property. | Land | Improvement |
|---|---|---|---|---|
| 2025 | $1,053 | $20,474 | $832 | $19,642 |
| 2024 | $555 | $20,474 | $832 | $19,642 |
| 2023 | $555 | $10,653 | $832 | $9,821 |
| 2022 | $959 | $20,474 | $832 | $19,642 |
| 2021 | $845 | $14,450 | $1,060 | $13,390 |
| 2020 | $465 | $14,450 | $1,060 | $13,390 |
| 2019 | $465 | $14,450 | $1,060 | $13,390 |
| 2018 | $490 | $14,450 | $1,060 | $13,390 |
| 2017 | $753 | $14,450 | $1,060 | $13,390 |
| 2016 | $688 | $18,380 | $5,750 | $12,630 |
| 2015 | $918 | $18,074 | $5,750 | $12,324 |
| 2014 | $918 | $16,574 | $5,750 | $10,824 |
Source: Public Records
Map
Nearby Homes
- 3600 E Kiehl Ave
- 404 May St
- 401 Calloway Ave
- 400 Cherrie Ave
- 309 May St
- 300 Calloway Ave
- 208 Calloway Ave
- 208 Ann Ave
- 114 May St
- 110 Ann Ave
- 6608 Southshore Ln
- 8711 Cayuga Ln
- Lot 2 Witts Dr
- Lot 1 Witts Dr
- 3116 Maxine Ave
- 608 Hemphill Rd
- 6 W Laramie Dr
- 5908 Glenhaven Place
- 604 Grandview St
- 2712 E Maryland Ave
- 607 Ridgelea Ave
- 601 Ridgelea Ave
- 604 Ridgelea Ave
- 608 Ridgelea Ave
- 610 Ridgelea Ave
- 613 Ridgelea Ave
- 511 Ridgelea Ave
- 305 Longstreth St
- 605 Sherer St
- 607 Sherer St
- 511 Calloway Ave
- 200 Longstreth St
- 509 Ridgelea Ave
- 510 Ridgelea Ave
- 611 Sherer St
- 205 Brockington Rd
- 509 Calloway Ave
- 8801 Brockington Rd
- 506 Calloway Ave
- 507 Ridgelea Ave