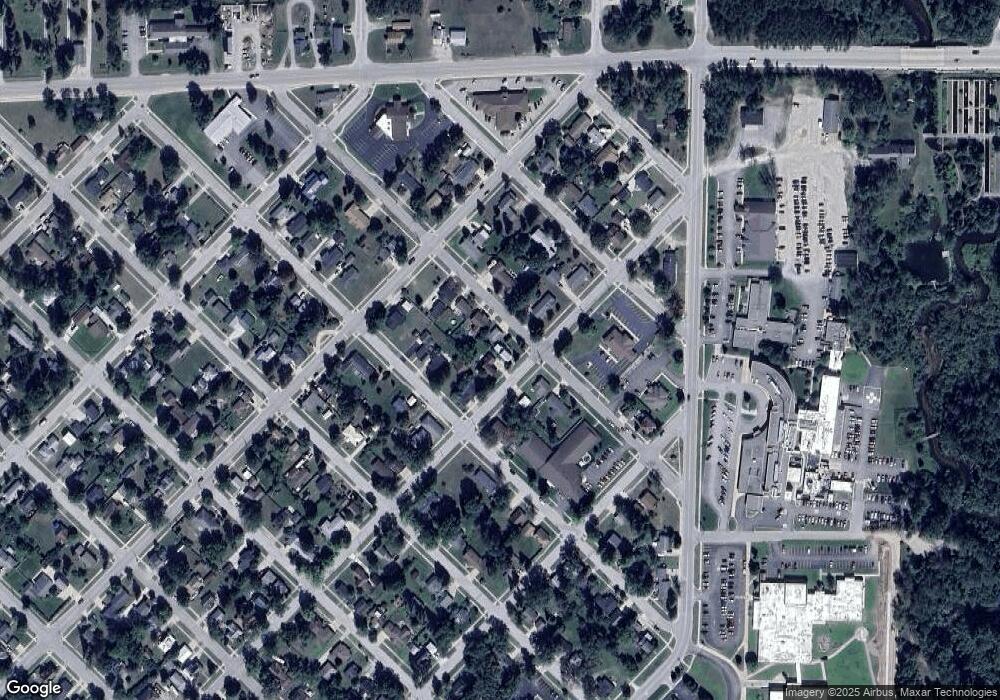
603 Rose St Grayling, MI 49738
Estimated Value: $147,000 - $175,000
4
Beds
2
Baths
2,780
Sq Ft
$57/Sq Ft
Est. Value
About This Home
This home is located at 603 Rose St, Grayling, MI 49738 and is currently estimated at $157,462, approximately $56 per square foot. 603 Rose St is a home located in Crawford County with nearby schools including Grayling Elementary School, Grayling Middle School, and Grayling High School.
Ownership History
Date
Name
Owned For
Owner Type
Purchase Details
Closed on
Jun 13, 2018
Sold by
Ferrigan Joseph S
Bought by
Ferrigan Joseph S and Ferrigan Pamela J
Current Estimated Value
Purchase Details
Closed on
Jun 19, 2014
Sold by
Michael C Michael C and Hultgren Michael
Bought by
Ferrigan Joseph S
Purchase Details
Closed on
Jun 6, 2009
Sold by
Hultgren Michael C
Bought by
Hultgren Michael C and Ferrigan Mar
Purchase Details
Closed on
Dec 9, 2005
Sold by
Clark Jason and Clark Lorraine
Bought by
Hultgren Michael C
Purchase Details
Closed on
Dec 19, 2000
Sold by
Englund David L
Bought by
Clark Jason and Wf Lorraine
Create a Home Valuation Report for This Property
The Home Valuation Report is an in-depth analysis detailing your home's value as well as a comparison with similar homes in the area
Home Values in the Area
Average Home Value in this Area
Purchase History
| Date | Buyer | Sale Price | Title Company |
|---|---|---|---|
| Ferrigan Joseph S | -- | -- | |
| Ferrigan Joseph S | -- | -- | |
| Hultgren Michael C | -- | -- | |
| Hultgren Michael C | $74,000 | -- | |
| Clark Jason | $70,900 | -- |
Source: Public Records
Tax History Compared to Growth
Tax History
| Year | Tax Paid | Tax Assessment Tax Assessment Total Assessment is a certain percentage of the fair market value that is determined by local assessors to be the total taxable value of land and additions on the property. | Land | Improvement |
|---|---|---|---|---|
| 2025 | $2,177 | $72,000 | $2,100 | $69,900 |
| 2024 | $1,889 | $68,000 | $2,100 | $65,900 |
| 2023 | $1,807 | $59,200 | $2,100 | $57,100 |
| 2022 | $1,717 | $52,200 | $2,100 | $50,100 |
| 2021 | $1,952 | $49,700 | $2,100 | $47,600 |
| 2020 | $1,925 | $47,600 | $2,100 | $45,500 |
| 2019 | $1,884 | $46,900 | $2,100 | $44,800 |
| 2018 | $1,847 | $42,500 | $2,100 | $40,400 |
| 2017 | $1,609 | $42,700 | $2,100 | $40,600 |
| 2016 | $677 | $18,100 | $2,100 | $16,000 |
| 2015 | -- | $18,100 | $0 | $0 |
| 2014 | -- | $19,100 | $0 | $0 |
| 2013 | -- | $19,700 | $0 | $0 |
Source: Public Records
Map
Nearby Homes
- 1205 E Michigan Ave
- 903 Ottawa St
- 705 Plum St
- 403 Erie St
- 701 Chestnut St
- 610 Spruce St
- 1024 S I-75 Business Loop
- 390 E Ember Trail
- 120 West Dr
- 601 Peninsular Ave
- 4593 Orbit Dr
- 794 M-72 E
- 000 W M-72 Hwy
- LOTS 71-75 Evergreen Dr
- 0 Helen Unit 1936684
- Lot #31 Helen Dr
- 4251 W Pinecrest Rd
- 6375 Hanner Trail
- 6324 W Pine Point Rd
- 4079 W Pinecrest Rd
