Estimated Value: $144,000 - $225,000
2
Beds
--
Bath
1,802
Sq Ft
$105/Sq Ft
Est. Value
About This Home
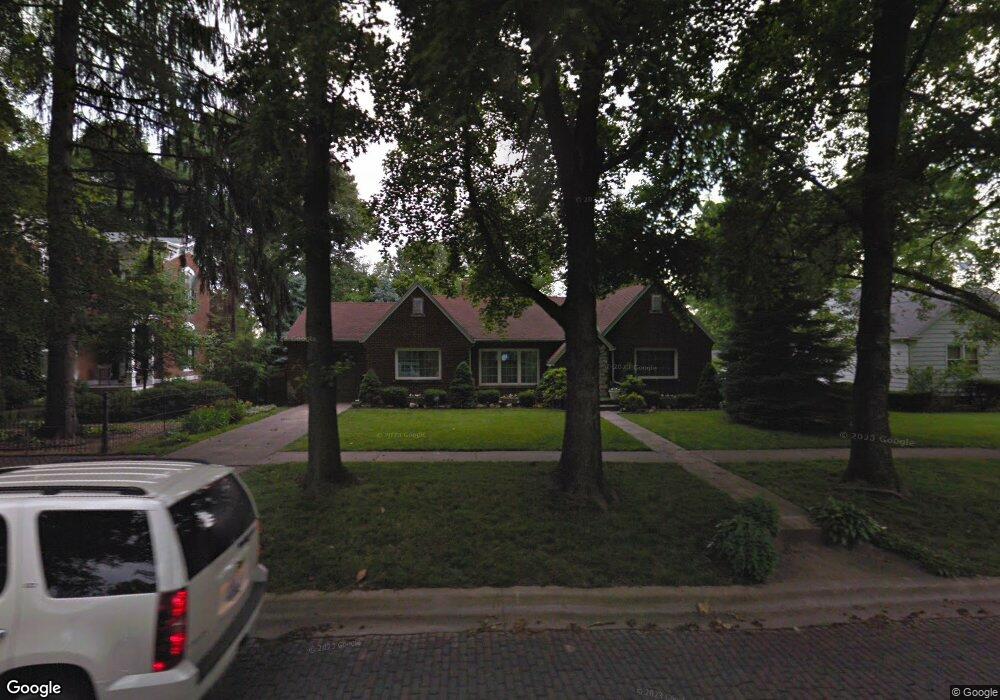
This home is located at 603 S Locust St, Pana, IL 62557 and is currently estimated at $188,765, approximately $104 per square foot. 603 S Locust St is a home located in Christian County with nearby schools including Washington Elementary School, Lincoln Elementary School, and Pana Jr High School.
Ownership History
Date
Name
Owned For
Owner Type
Purchase Details
Closed on
Jan 25, 2024
Sold by
Koons Lloyd Tyler and Koons Kristen
Bought by
Ludwig Edward F
Current Estimated Value
Purchase Details
Closed on
Jun 1, 2012
Sold by
Blakley Linda Jo and Sprinkle Sharon Dian
Bought by
Koons Lloyd Tyler and Koons Kristen
Home Financials for this Owner
Home Financials are based on the most recent Mortgage that was taken out on this home.
Original Mortgage
$120,772
Interest Rate
4.25%
Mortgage Type
FHA
Create a Home Valuation Report for This Property
The Home Valuation Report is an in-depth analysis detailing your home's value as well as a comparison with similar homes in the area
Home Values in the Area
Average Home Value in this Area
Purchase History
| Date | Buyer | Sale Price | Title Company |
|---|---|---|---|
| Ludwig Edward F | $185,000 | Advanced Title | |
| Koons Lloyd Tyler | $123,000 | None Available |
Source: Public Records
Mortgage History
| Date | Status | Borrower | Loan Amount |
|---|---|---|---|
| Previous Owner | Koons Lloyd Tyler | $120,772 |
Source: Public Records
Tax History Compared to Growth
Tax History
| Year | Tax Paid | Tax Assessment Tax Assessment Total Assessment is a certain percentage of the fair market value that is determined by local assessors to be the total taxable value of land and additions on the property. | Land | Improvement |
|---|---|---|---|---|
| 2024 | $365 | $48,228 | $4,273 | $43,955 |
| 2023 | $3,905 | $45,567 | $4,037 | $41,530 |
| 2022 | $3,709 | $42,144 | $4,010 | $38,134 |
| 2021 | $3,617 | $41,317 | $3,931 | $37,386 |
| 2020 | $3,494 | $39,564 | $3,764 | $35,800 |
| 2019 | $3,531 | $40,496 | $3,853 | $36,643 |
| 2018 | $3,125 | $36,641 | $3,766 | $32,875 |
| 2017 | $3,157 | $37,389 | $3,843 | $33,546 |
| 2016 | $3,121 | $37,284 | $3,832 | $33,452 |
| 2015 | $3,110 | $36,852 | $3,788 | $33,064 |
| 2014 | $2,851 | $34,276 | $3,523 | $30,753 |
| 2013 | $2,858 | $34,157 | $3,524 | $30,633 |
| 2011 | $1,206 | $34,964 | $3,607 | $31,357 |
Source: Public Records
Map
Nearby Homes