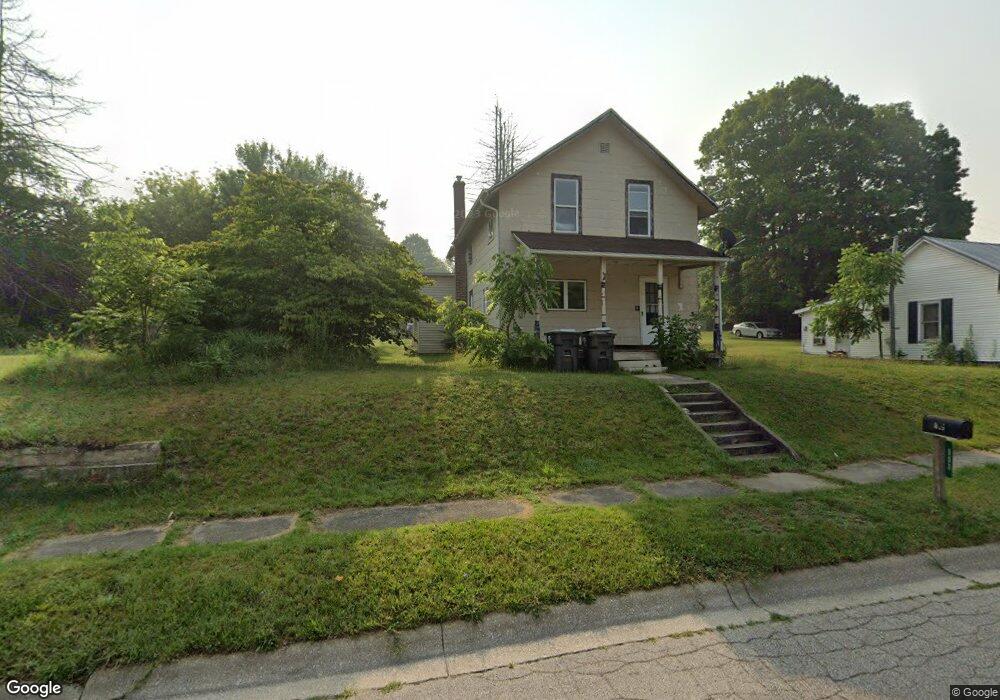
603 S Oak St Buchanan, MI 49107
Estimated Value: $122,000 - $186,000
2
Beds
2
Baths
1,264
Sq Ft
$122/Sq Ft
Est. Value
About This Home
This home is located at 603 S Oak St, Buchanan, MI 49107 and is currently estimated at $154,537, approximately $122 per square foot. 603 S Oak St is a home located in Berrien County with nearby schools including Ottawa Elementary School, Moccasin Elementary School, and Buchanan Middle School.
Ownership History
Date
Name
Owned For
Owner Type
Purchase Details
Closed on
Nov 13, 2008
Sold by
Cole William R and Cole Patricia A
Bought by
Federal National Mortgage Association
Current Estimated Value
Purchase Details
Closed on
Dec 7, 2005
Sold by
Plank Wade and Plank Rachel M
Bought by
Cole William R and Cole Patricia A
Home Financials for this Owner
Home Financials are based on the most recent Mortgage that was taken out on this home.
Original Mortgage
$78,280
Interest Rate
6.48%
Mortgage Type
Fannie Mae Freddie Mac
Purchase Details
Closed on
Sep 4, 2002
Purchase Details
Closed on
Aug 15, 1996
Purchase Details
Closed on
Jul 23, 1993
Purchase Details
Closed on
Apr 13, 1990
Purchase Details
Closed on
Nov 2, 1988
Purchase Details
Closed on
Sep 8, 1987
Create a Home Valuation Report for This Property
The Home Valuation Report is an in-depth analysis detailing your home's value as well as a comparison with similar homes in the area
Home Values in the Area
Average Home Value in this Area
Purchase History
| Date | Buyer | Sale Price | Title Company |
|---|---|---|---|
| Federal National Mortgage Association | $87,870 | None Available | |
| Cole William R | $78,280 | None Available | |
| -- | -- | -- | |
| -- | $51,500 | -- | |
| -- | $39,000 | -- | |
| -- | $100 | -- | |
| -- | -- | -- | |
| -- | -- | -- |
Source: Public Records
Mortgage History
| Date | Status | Borrower | Loan Amount |
|---|---|---|---|
| Previous Owner | Cole William R | $78,280 |
Source: Public Records
Tax History Compared to Growth
Tax History
| Year | Tax Paid | Tax Assessment Tax Assessment Total Assessment is a certain percentage of the fair market value that is determined by local assessors to be the total taxable value of land and additions on the property. | Land | Improvement |
|---|---|---|---|---|
| 2025 | $2,541 | $51,700 | $0 | $0 |
| 2024 | $2,410 | $44,100 | $0 | $0 |
| 2023 | $1,430 | $35,100 | $0 | $0 |
| 2022 | $1,389 | $28,800 | $0 | $0 |
| 2021 | $1,430 | $26,300 | $2,900 | $23,400 |
| 2020 | $1,411 | $26,100 | $0 | $0 |
| 2019 | $1,385 | $25,700 | $1,400 | $24,300 |
| 2018 | $1,361 | $25,700 | $0 | $0 |
| 2017 | $1,335 | $25,900 | $0 | $0 |
| 2016 | $1,325 | $25,600 | $0 | $0 |
| 2015 | $1,322 | $24,400 | $0 | $0 |
| 2014 | $1,219 | $23,200 | $0 | $0 |
Source: Public Records
Map
Nearby Homes
- 501 S Oak St
- 404 S Red Bud Trail
- 113 W Chicago St
- 201 S Oak St
- 103 W Smith St
- 302 Sylvan St
- 4047 Wildon Ct
- 106 Lake St
- 802 Carrol St
- 111 W 4th St
- 209 Terre Coupe St
- 313 N Red Bud Trail
- 322 N Cayuga St
- 204 Willow Dr
- 118 Schirmer Pkwy
- 507 Middleton Ct
- Track 4 W Us 12 Hwy Trail
- 317 Elizabeth St
- 747 Chippewa St
- 426 Elizabeth St